Track Playwright visual regression tests in Qase
We're testing our own UI kit with our Playwright reporter. Our team routes screenshots and diffs directly to our test cases, which saves us from digging through old CI runs. We catch real regressions fast.


Anastasiia Khabarova and Andrei Vaganov
Visual tests fail for boring reasons more often than real ones. A font renders half a pixel differently on the CI box than on your Mac, antialiasing shifts, and a screenshot comes back "wrong." The diff is real. The regression isn't. So you download artifacts from a GitHub Actions run to confirm it's nothing, and that's twenty minutes gone.
The comparison part is easy. Telling a real regression from render noise, run after run, is the part that eats your afternoon.
Playwright handles the comparison well. It mounts the component, disables animations, waits for fonts, then diffs against a baseline. What it doesn't give you is a durable place to look at the result. The expected image is in your repo, the actual and diff land in test-results, and that folder is gone when the runner exits.
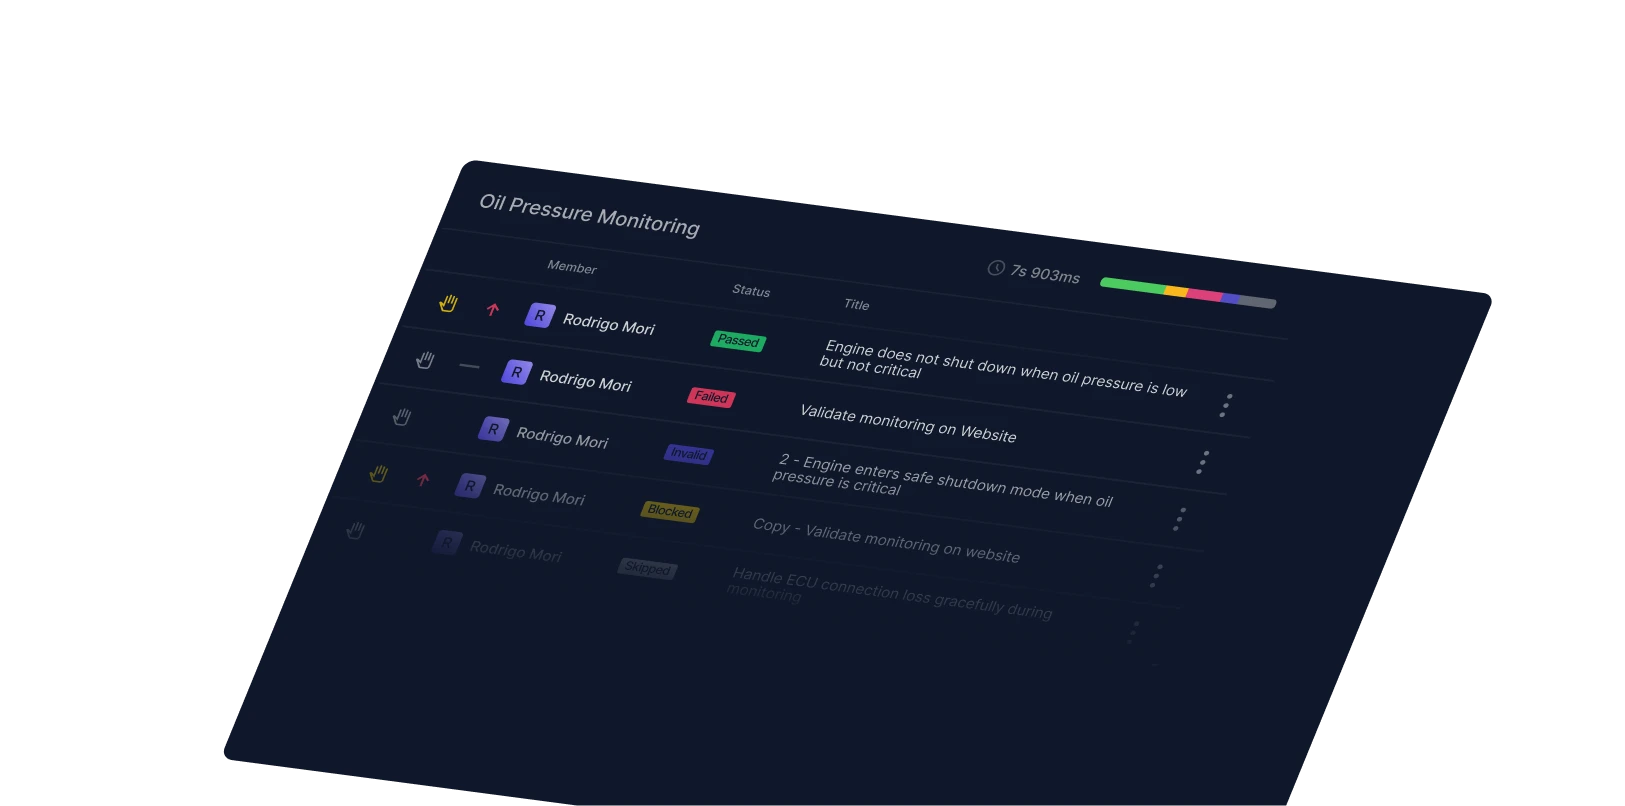
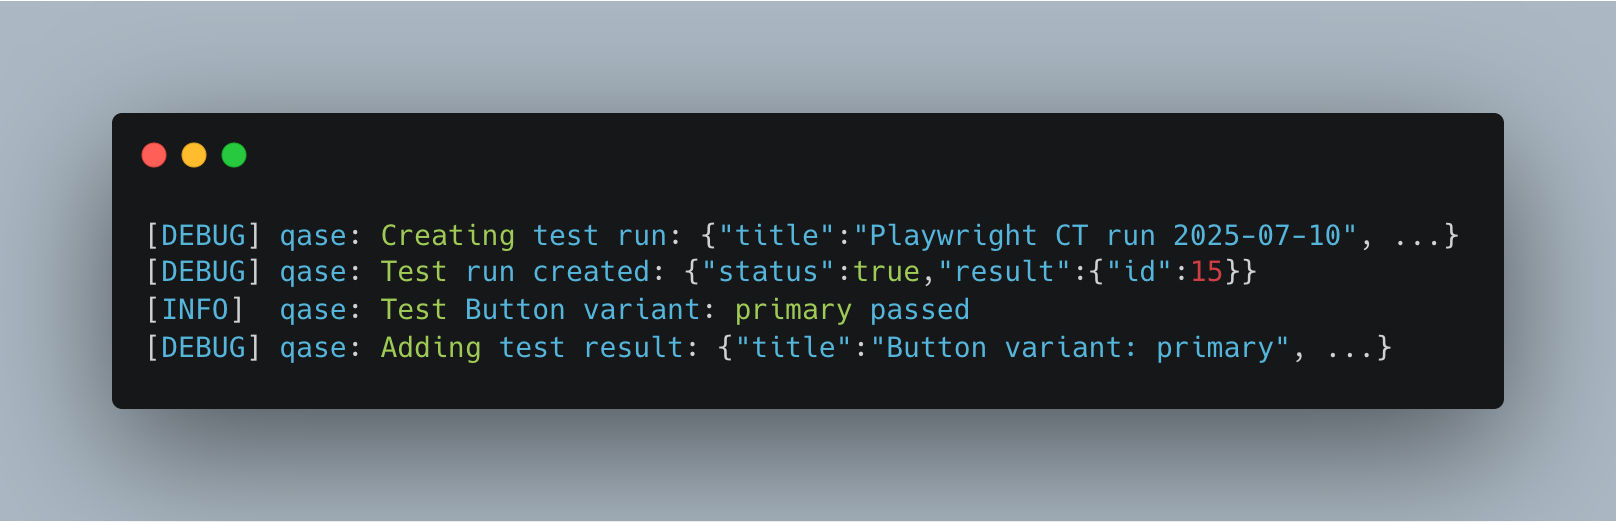
The Qase Playwright reporter keeps the result. The failure shows up with the expected, actual, and diff images, the full call log, and a link back to the CI run, on a test case with history you can scroll.
We run this on Qase's own UI kit, so everything below is from a real run.
What we actually screenshot
You don't screenshot everything. Full coverage of every component gives you a suite that flaps red on every minor style tweak, and people stop trusting it.
Our QA and frontend engineers pick targets together, and the rule is narrow. A component earns a visual test if it's one of these:
- Visually sensitive, where a few pixels off is a real bug (buttons, inputs, badges).
- Complex layout, where spacing and alignment break in non-obvious ways.
- Changes often, so a regression is statistically likely.
- Everything else gets functional tests and nothing more.
One detail that keeps the suite stable: these run at the component level, not the page level. Playwright mounts a single component in isolation and screenshots that. Unrelated changes elsewhere in the app don't move the pixels, so the test stays focused on the one thing it's watching.
The setup
A test that mounts a component and takes a screenshot:
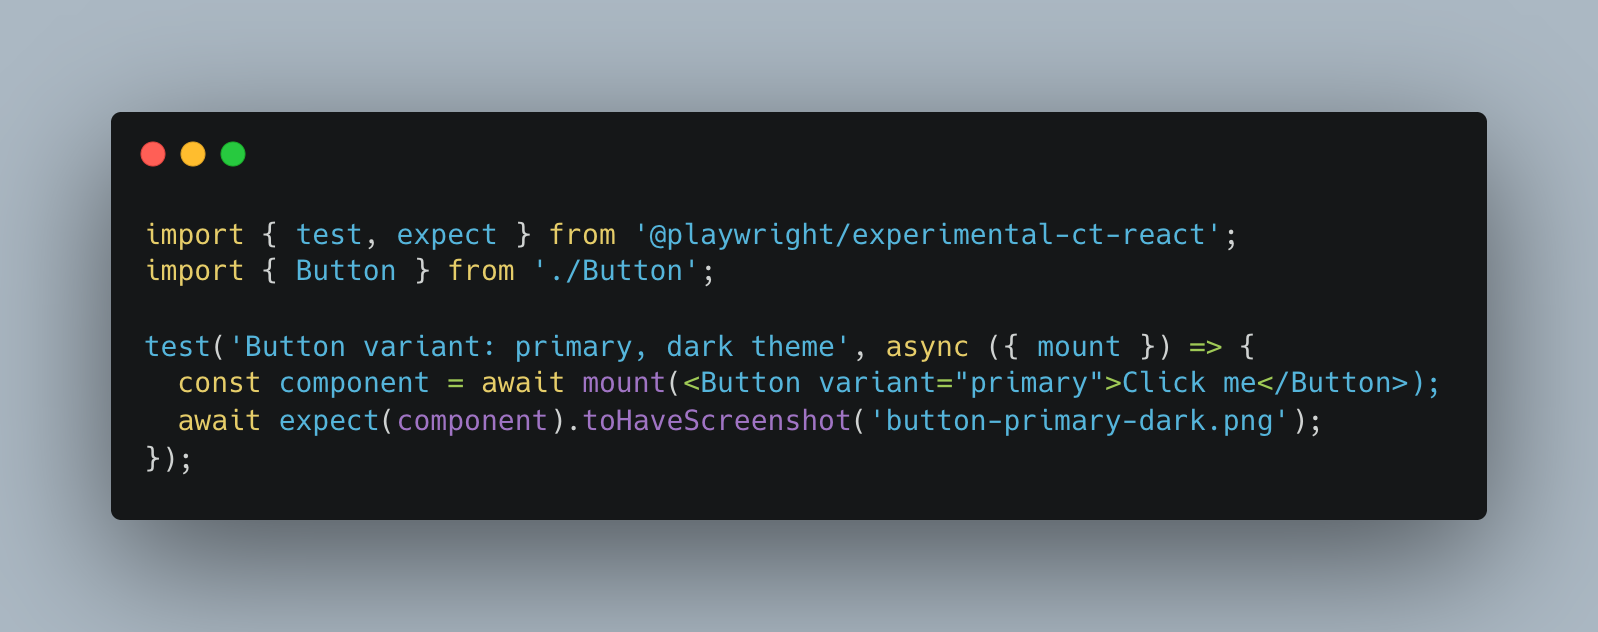
The baseline (button-primary-dark.png) lives in your repo under __screenshots__. If you generate baselines on your laptop and run tests in Linux CI, expect them to disagree. Generate them in the same environment you test in, usually a Docker image matching the runner, or you'll chase phantom diffs forever.
Then the reporter in playwright.config.ts. The one setting that matters is uploadAttachments. That's what carries the three images into Qase:
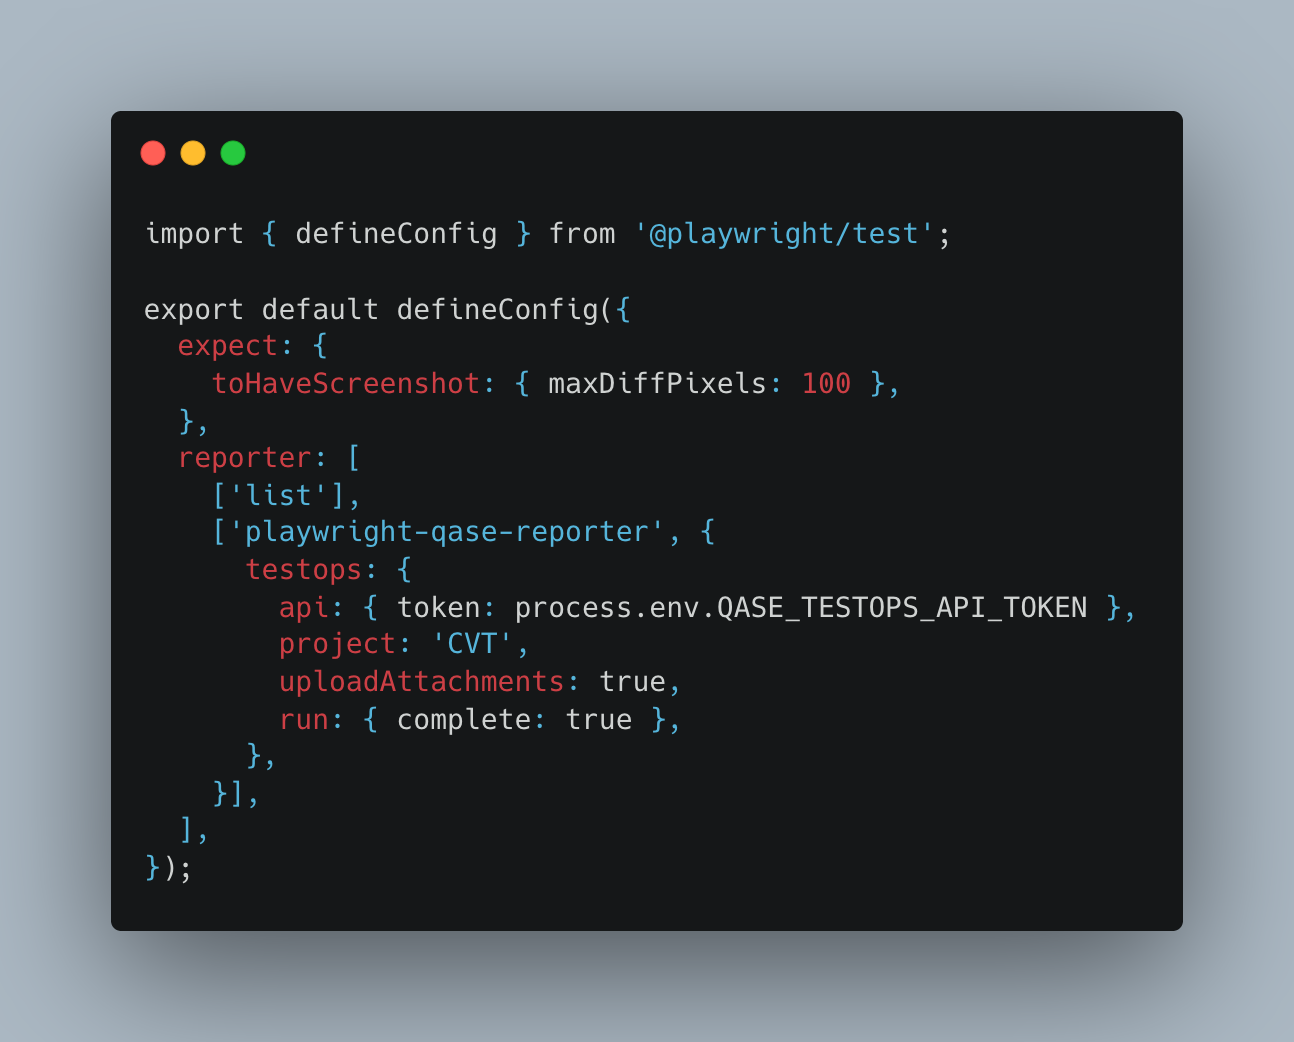
maxDiffPixels (or maxDiffPixelRatio) is your noise filter. Set it too tight and font rendering flaps your suite red. Too loose and you miss the regression you actually care about. Tune it per project, not globally.
Running it in CI
We run the screenshots as their own GitHub Actions job, separate from unit and e2e tests. Two reasons. A flaky visual diff shouldn't block an unrelated unit job, and when something does fail you can re-run just the screenshots without replaying the whole pipeline. The job builds the UI kit, runs the component tests, and the reporter ships results to Qase. Start to finish, about 2m 17s.
What lands in Qase
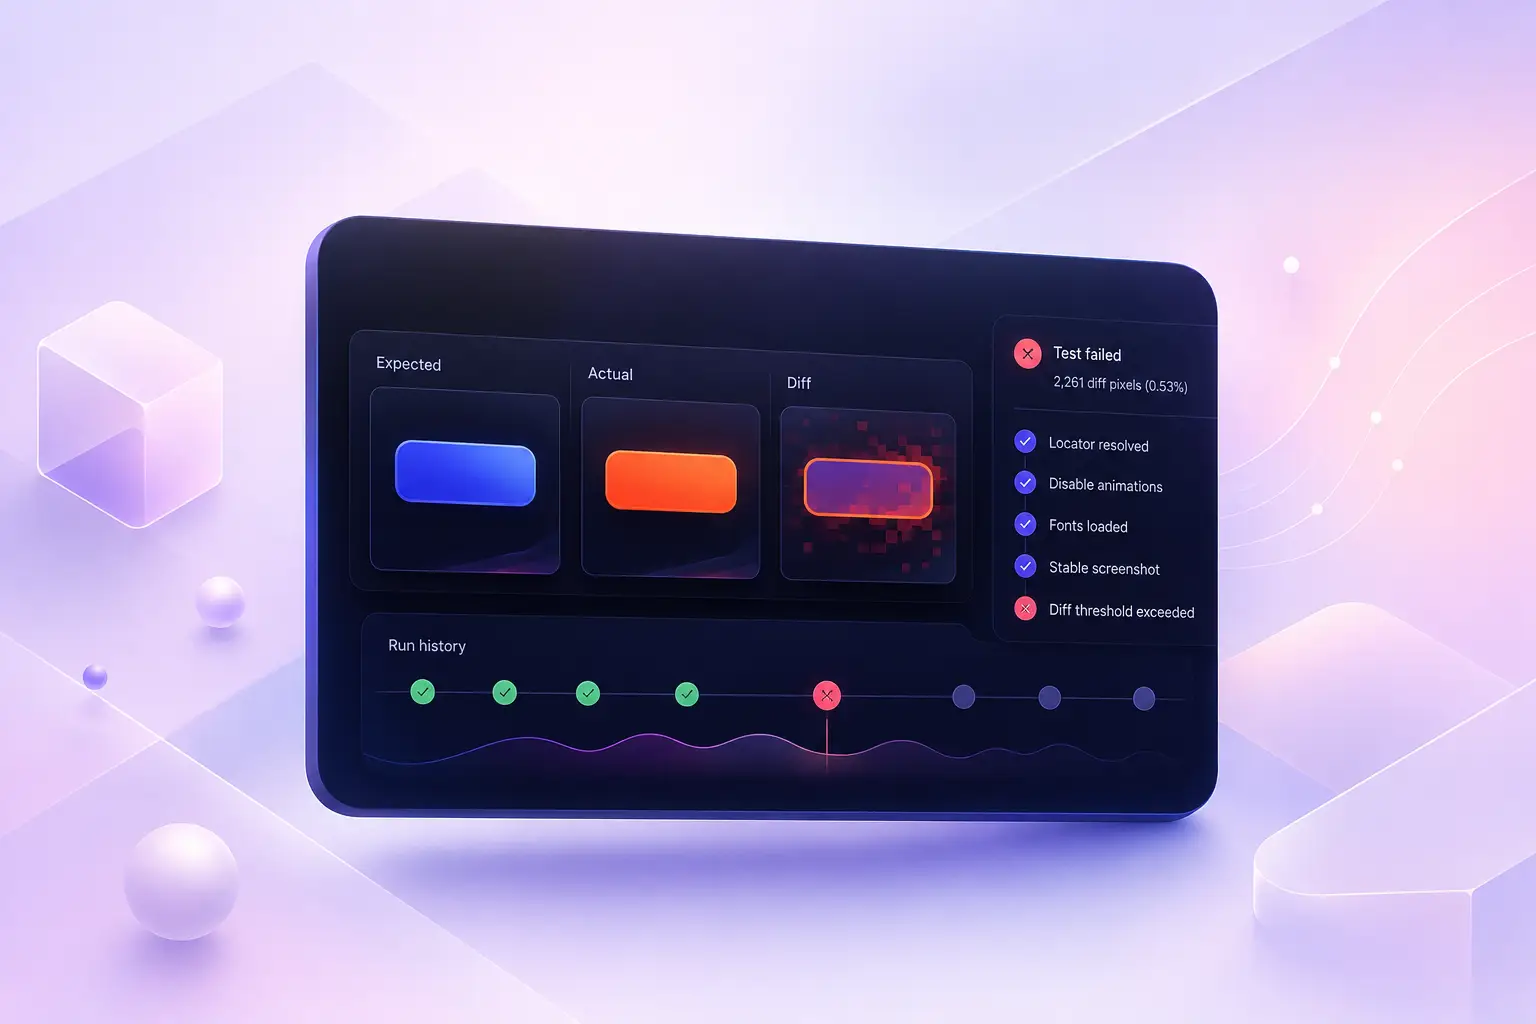
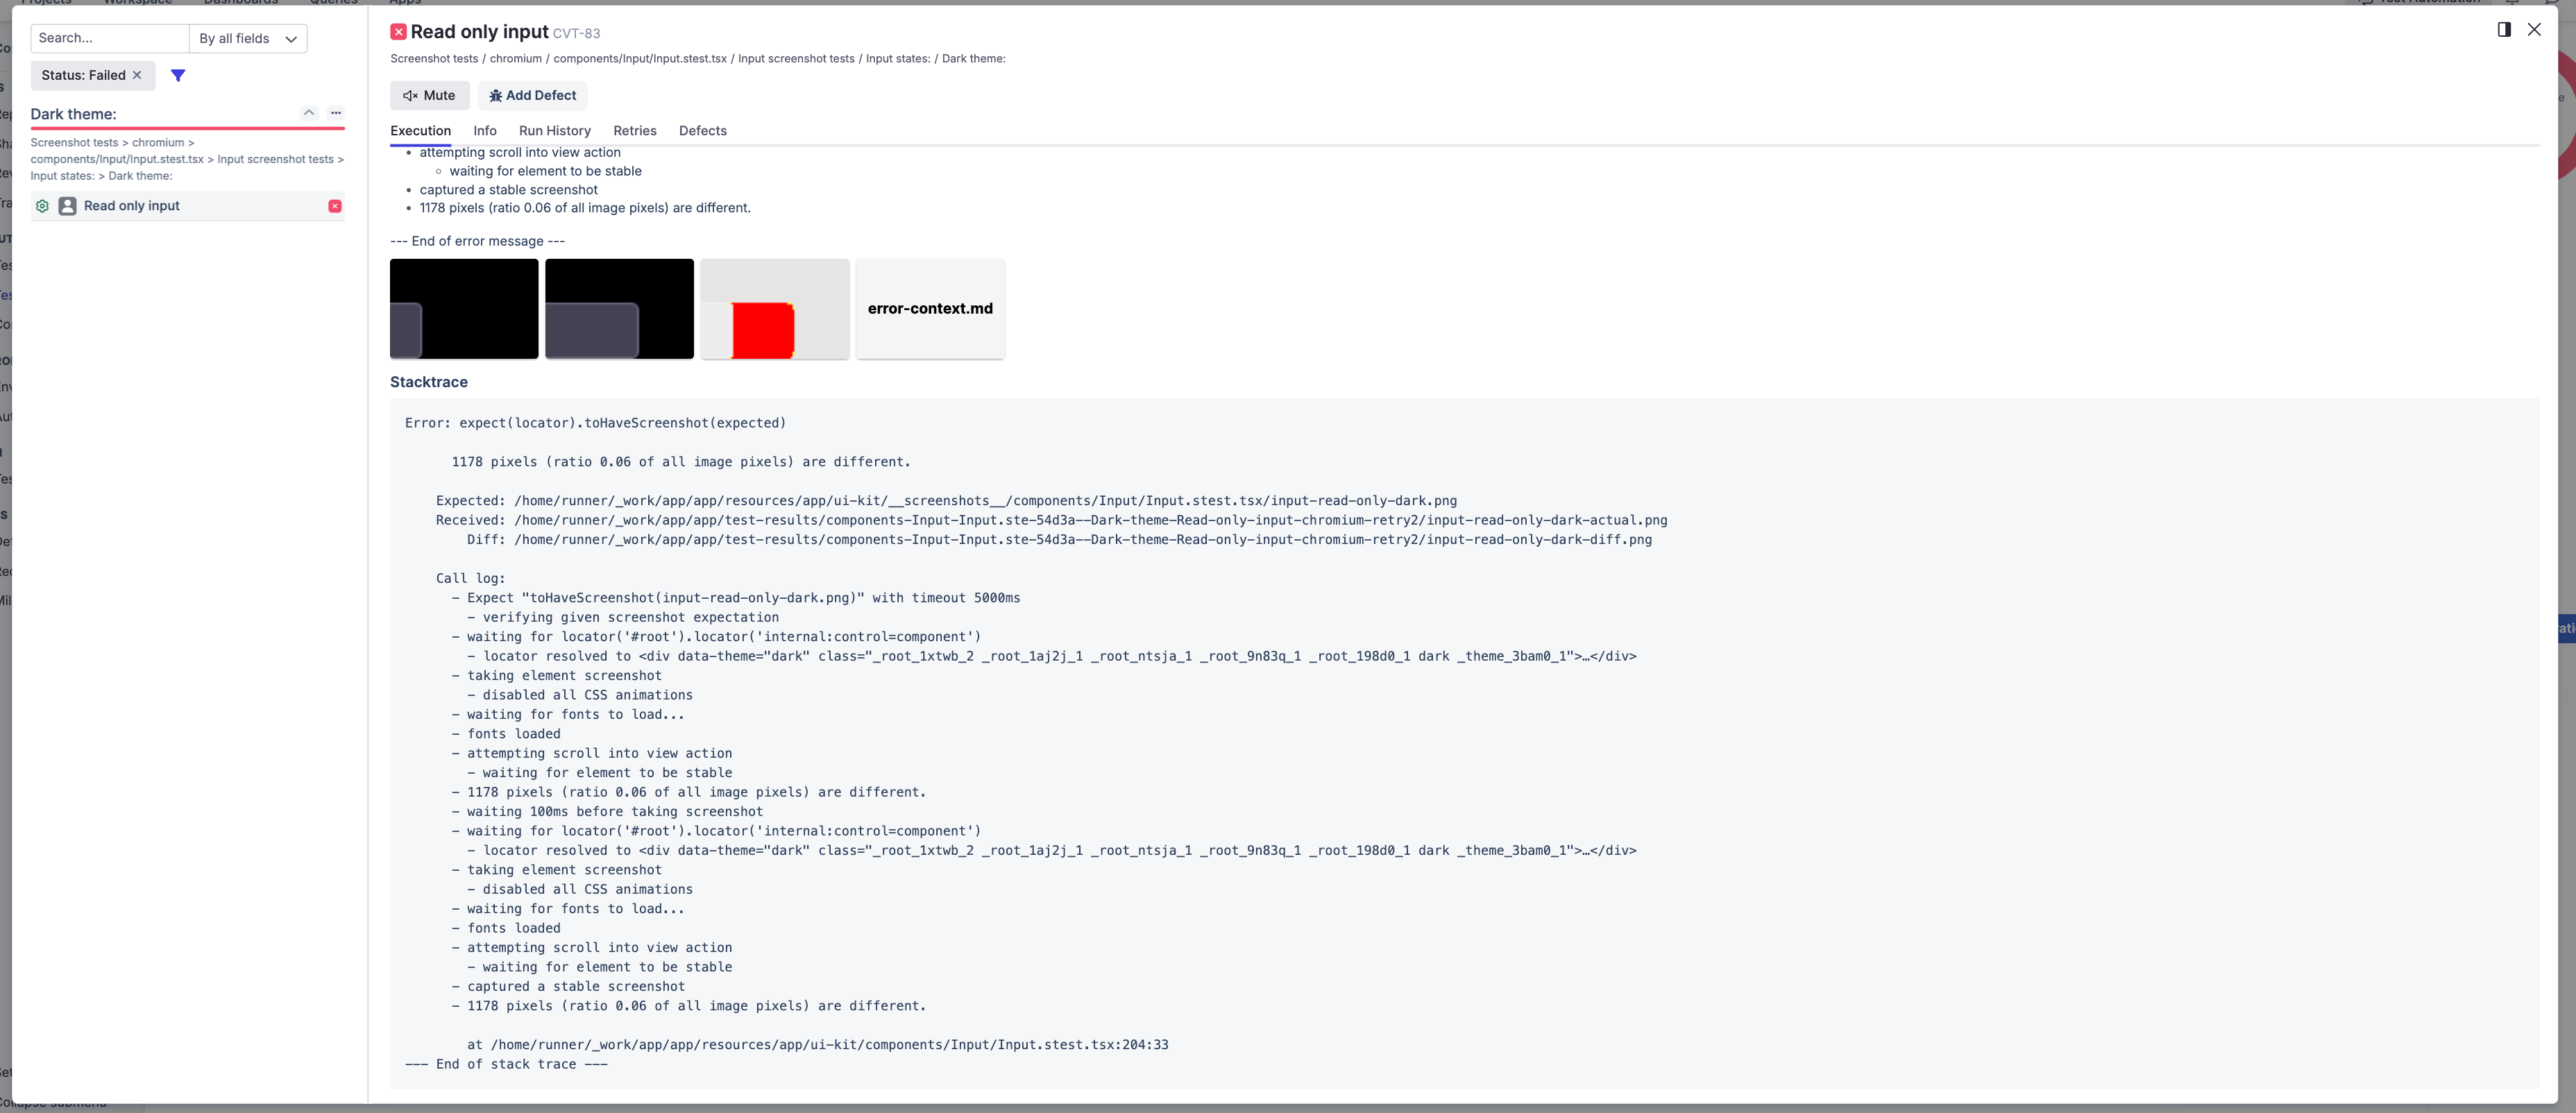
Here's a real failure. The primary button on dark theme regressed, blue baseline against an orange actual, and Playwright flagged 2,261 different pixels, ratio 0.53 of the image. More than half the button changed, so this isn't noise, it's a genuine regression someone needs to look at.
Instead of a CI log, this showed up in Qase on case CVT-10:
- Expected, actual, and the diff images inline, plus the error-context.md Playwright writes.
- The call log: locator resolved, CSS animations disabled, fonts loaded, stable screenshot captured, then the pixel count that tripped the assertion.
- The repo paths for the expected, received, and diff files.
- A link back to the GitHub Actions run, executed by Playwright, 472ms.
Telling flaky from real
This is the part that pays for itself. A single red screenshot tells you almost nothing. The same case on a test with run history tells you a lot.
The button above is easy: 53% of the image changed and it stayed red after a known style change. Real regression, close it. The hard cases are the small ones. A case that came back 30 pixels off, then green, then 30 pixels off again across three runs with no code change between them, is environmental. Tighten the wait, pin the font, or raise the threshold. A case that went red right after a CSS change and stayed red is the one to chase, and the diff image shows you which element moved.
You get that read by looking at one place: the case, its history, and whether a defect is already open against it. That's the reason to push diffs into a test management tool instead of re-downloading artifacts every time.
Same approach, other frameworks
Playwright is the example, not the requirement. The pattern works wherever the run produces a diff image and the reporter can upload attachments.
- Cypress. Add a visual plugin like cypress-image-diff, set uploadAttachments: true, and point the reporter at cypress/screenshots. Same three images come through.
- WebdriverIO. Its visual service does the comparison, and the Qase reporter attaches screenshots by default.
The framework compares the pixels, the reporter ships the result, Qase keeps it.
Try it
Take one component that already has a snapshot test, add the reporter, set uploadAttachments: true, and let it fail once on purpose. Tweak a padding value, watch the diff land in Qase with the call log. If it's useful, wire up the rest of the suite.