Nobody can answer 'are we ready to ship?'
The question goes to a meeting, not a dashboard. Release readiness is a feeling, not a fact — and the answer changes depending on who you ask.
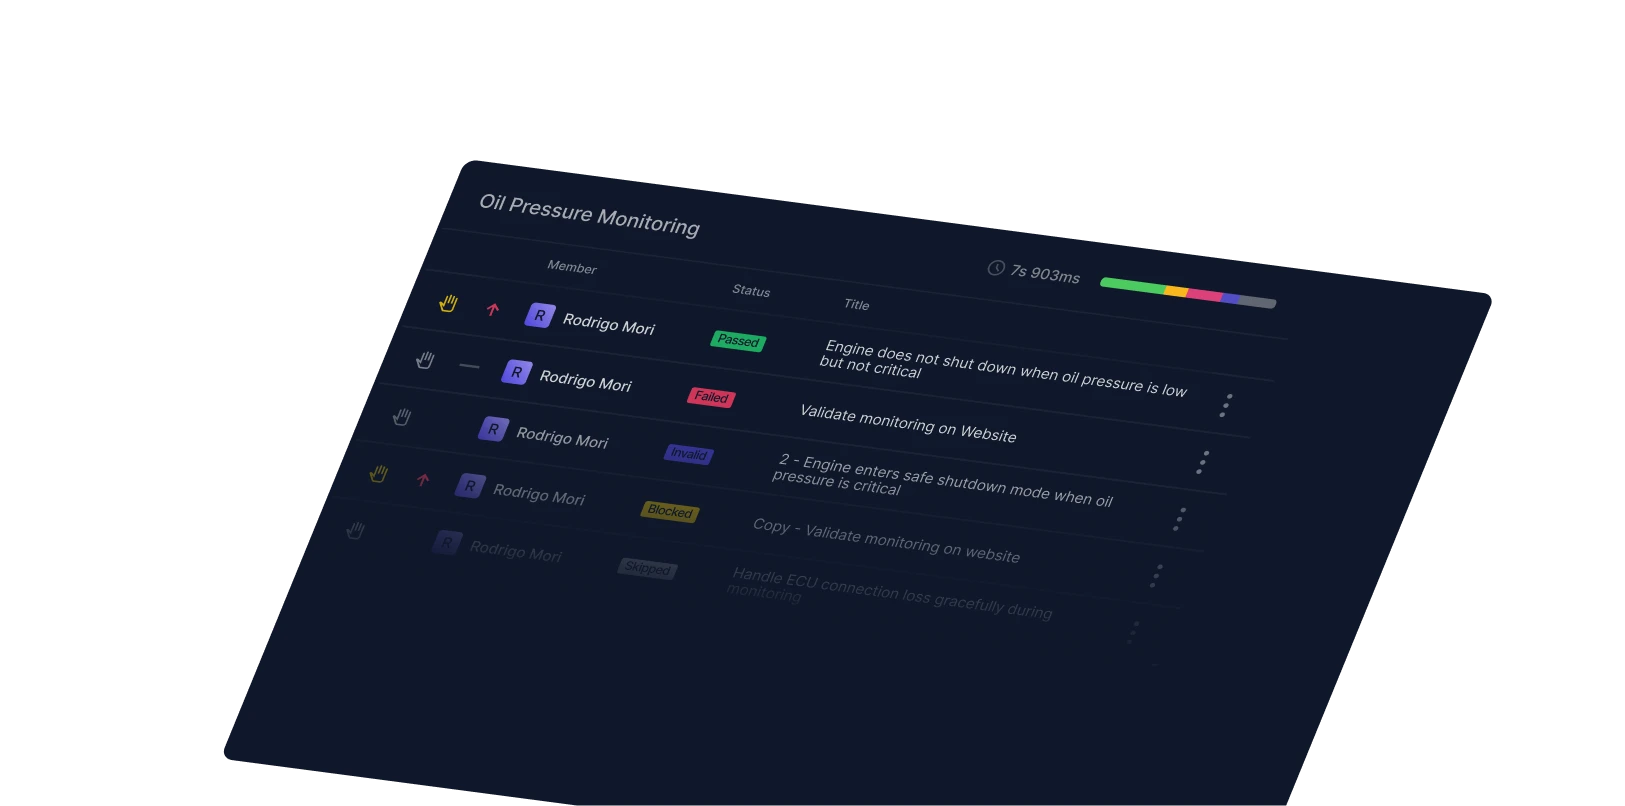
Qase connects your test data, coverage, and defect trends into a single live view. Engineering teams get the signal they need to make the call, without assembling a report first.
If your team can't answer 'are we ready?' from data, the answer is coming from a conversation instead.
The question goes to a meeting, not a dashboard. Release readiness is a feeling, not a fact — and the answer changes depending on who you ask.
CI shows automation results. Tickets hold defects. Spreadsheets track manual runs. Nobody has the full picture, and pulling it together takes time nobody has.
Requirements and test outcomes live in separate systems. What was tested and what wasn't only becomes clear after something fails in production.
Automation ratio, velocity, flaky test count. If those numbers aren't live and queryable, they're estimates — and estimates aren't useful at release time.
Someone compiles the QA summary hours before a release. It takes time, and by the time it's done, parts of it are already wrong.
Engineering directors, PMs, and tech leads can't see quality trends without an account or a status update. They make release calls without the data.
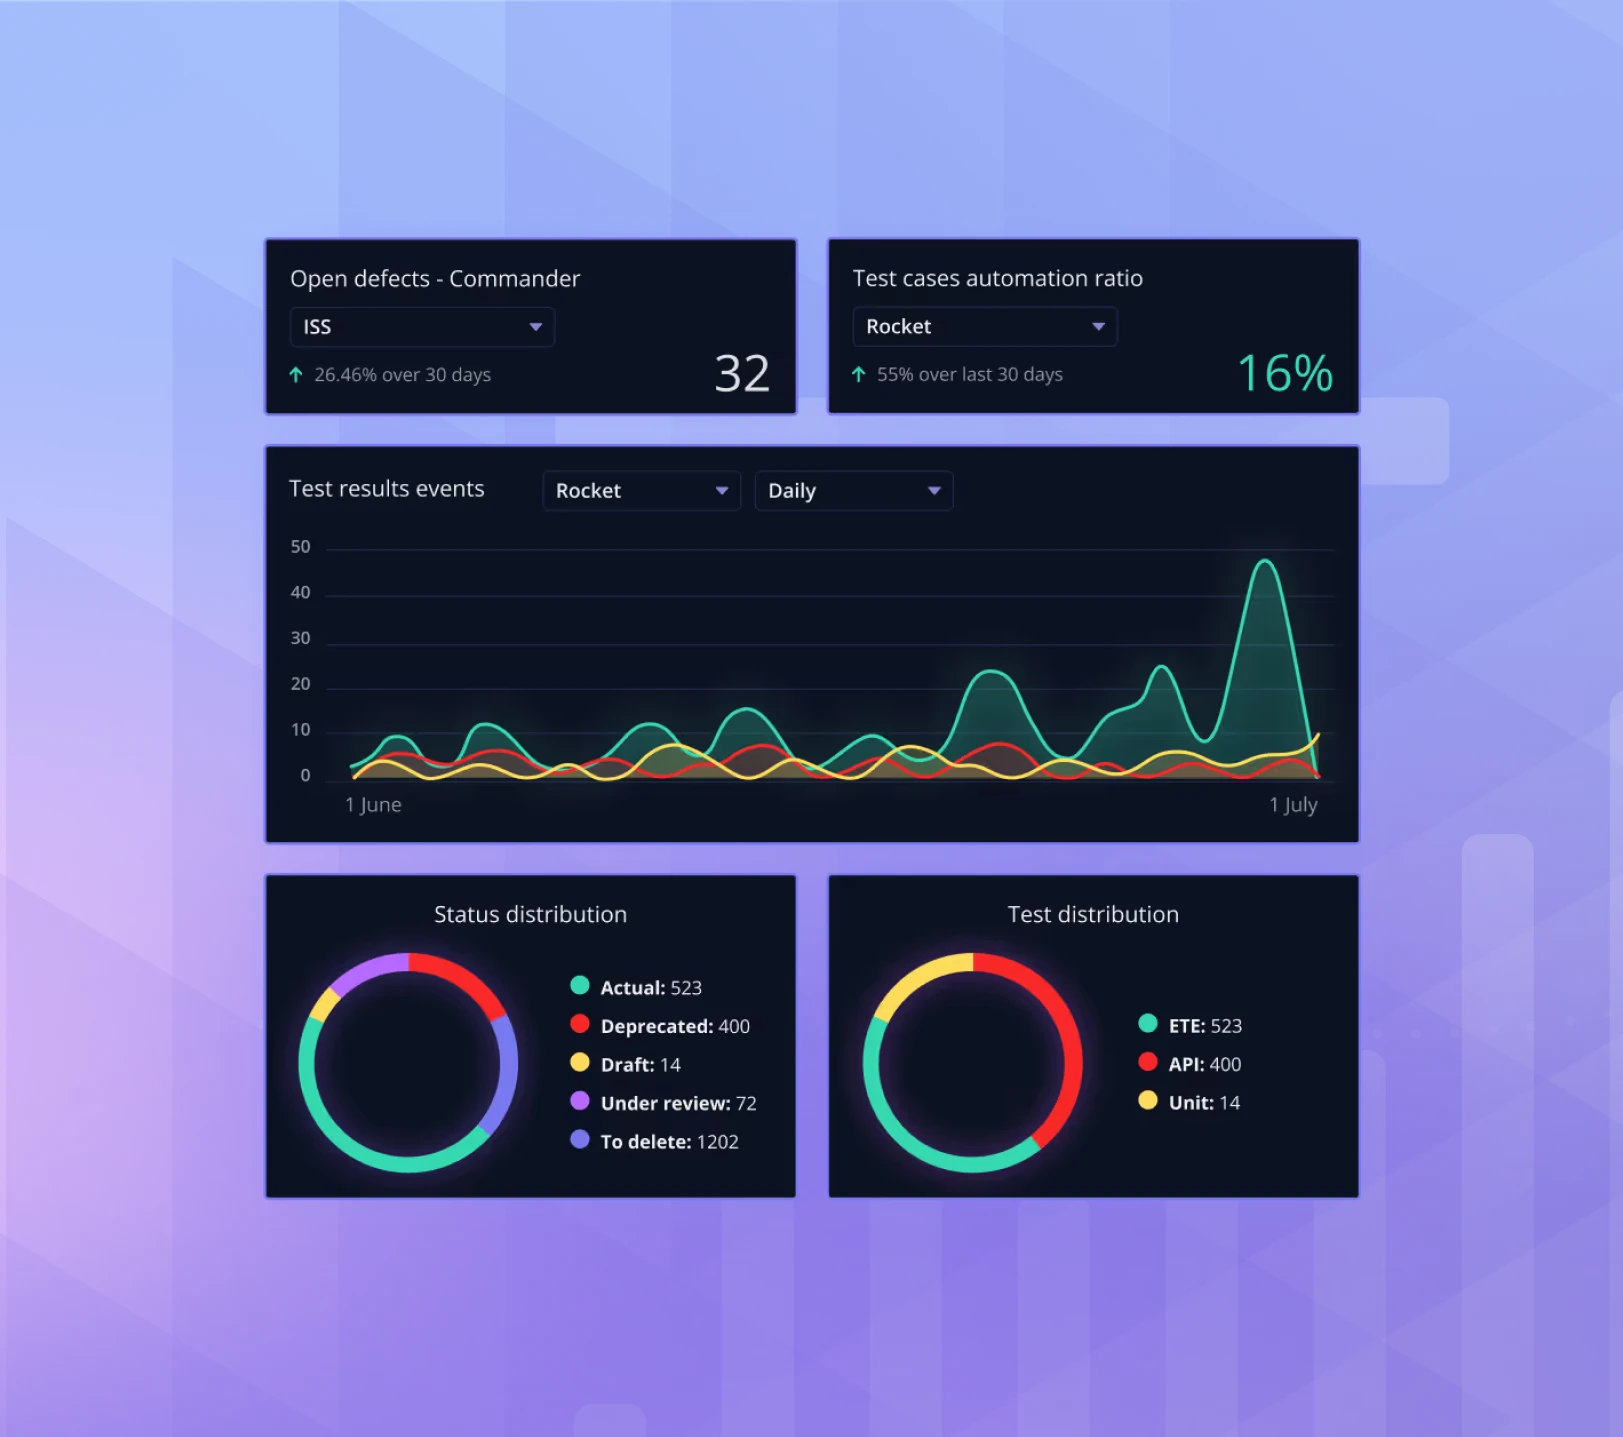
Build dashboards across your whole workspace or individual projects. Track automation ratios, defect trends, and active test runs in one view. Single-value widgets show where you stand today. Time-series widgets show where quality is heading.
Share via a public link; engineering directors and PMs get a live view without needing a Qase account.
Five widget types: single value, timed value, distribution, time series, QQL table.
The Requirements Traceability Report maps test cases to requirements from Jira, GitHub, and GitLab. It shows which requirements have coverage, which don't, and the current test result for each.
Stale case detection flags requirements updated after their linked tests last ran.
Generate snapshots over time to track coverage sprint over sprint. Export as CSV or PDF.
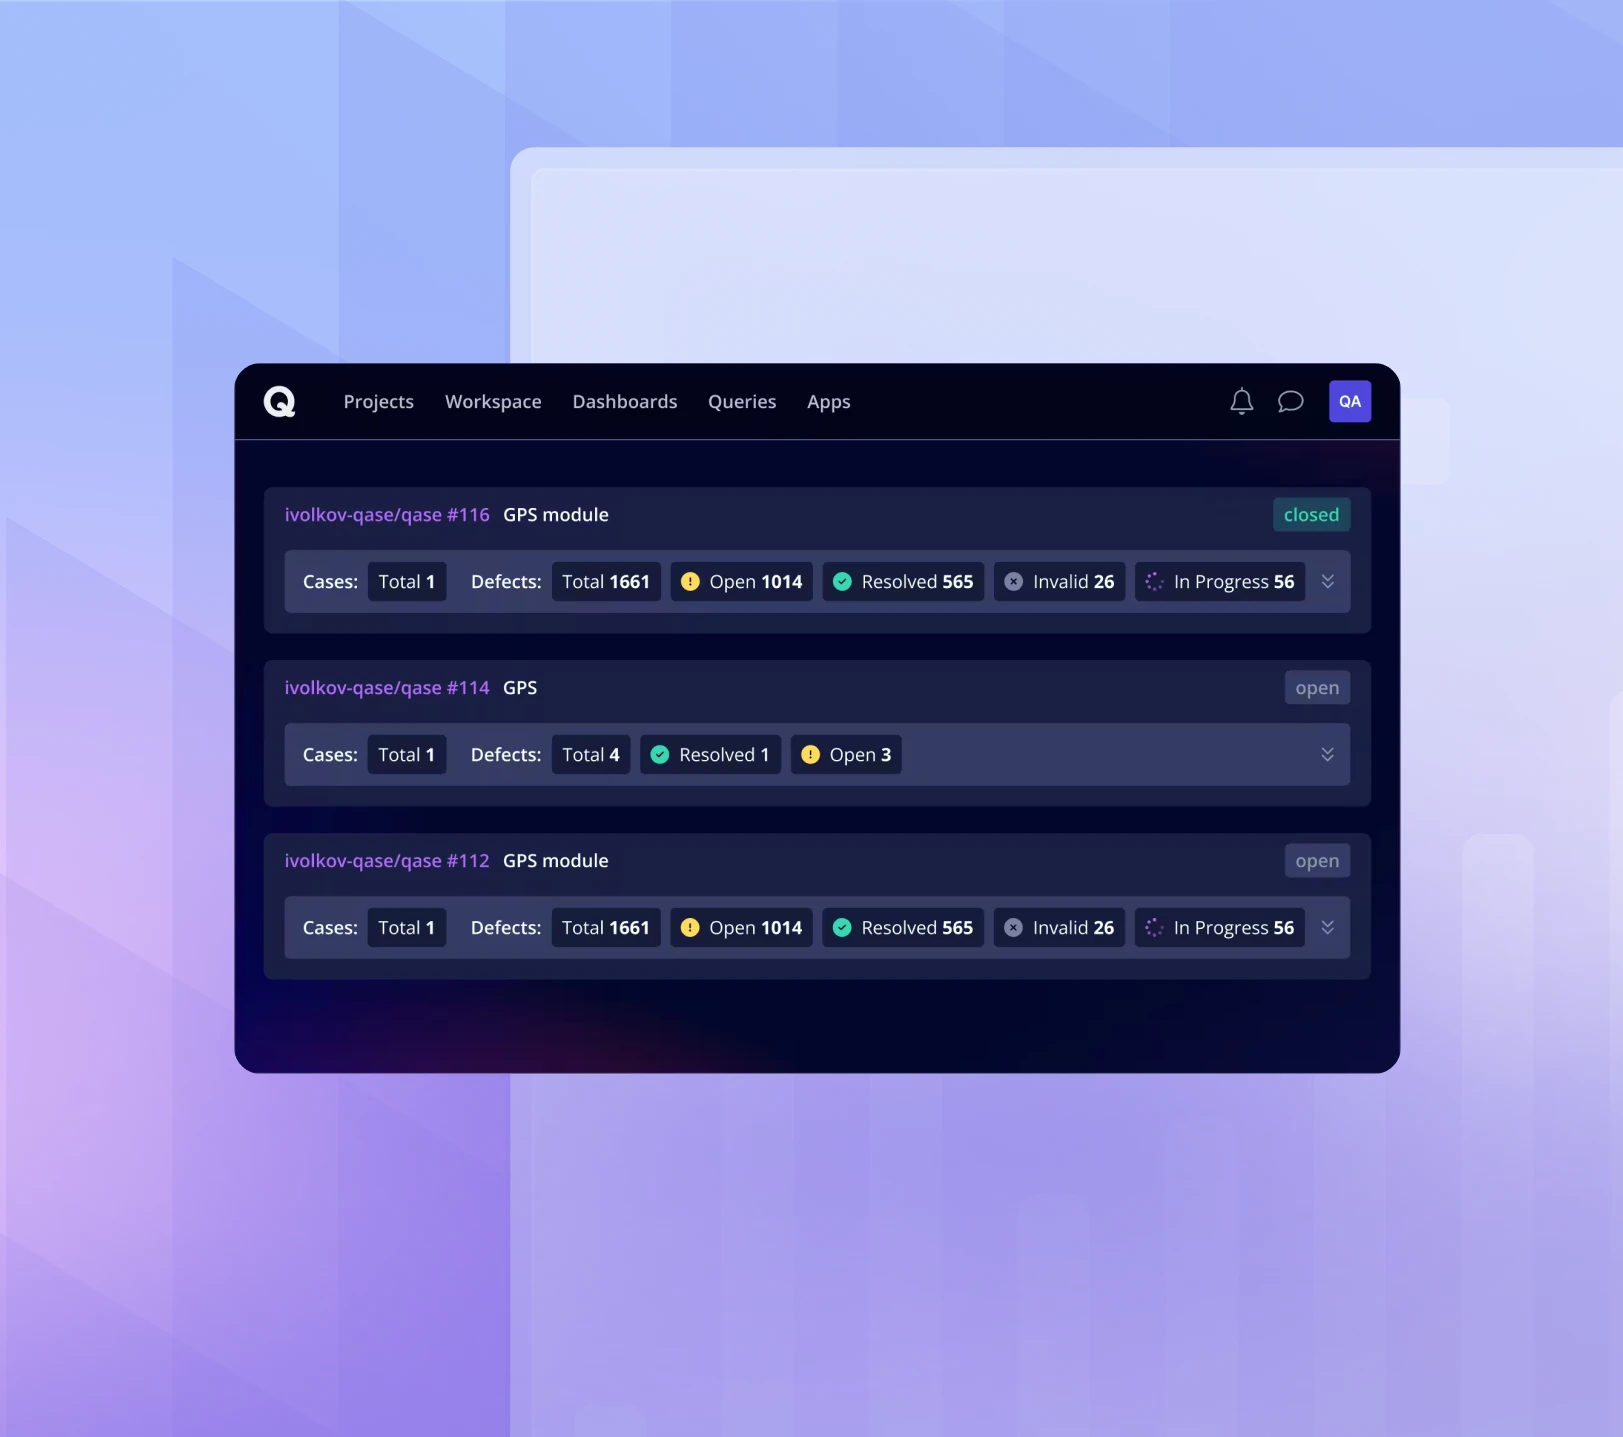
QQL lets you query any entity in Qase: test cases, defects, runs, results, plans, and requirements. Filter by status, project, author, custom field, date range, or milestone. Pin results to dashboards as live tables.
All failed results in Sprint 12: entity = "result" and status = "failed" and milestone ~ "Sprint 12"
Critical open defects modified in the last 14 days: entity = "defect" and severity = "critical" and updated >= now("-14d")
SUSE’s QA activity was a black box to anyone outside the immediate team. Leadership had no aggregate view of coverage or automation investment across Rancher’s cloud-native products. Engineering managers couldn’t prove quality.
“We had no requirements traceability, no requirement coverage. Automation velocity or manual vs. automated ratios across products were impossible to prove.”
SUSE built aggregate dashboards across all their cloud-native products, with per-product views for each team. Architects browse Qase for test history, and engineering managers track release readiness from data, not conversation.
“Testing is usually very opaque to anyone not in QA or development. The dashboards and metrics open a window into what teams are actually doing.”
5 widget types
Single value, timed value, distribution, time series, QQL table
Cross-project scope
All workspace projects, selected projects, or per-project views
Public sharing
Live dashboards via link, no account required
Saved queries
Pin any QQL query to a dashboard as a live table
QQL entities
Test case, test run, test result, test plan, defect, requirement
Requirements Traceability
Jira, GitHub, GitLab support with CSV and PDF export