What we learned shipping 83 MCP tools, and why v2 has 30

Nitin Deshmukh
What we learned shipping 83 MCP tools, and why v2 has 30
By Nitin Deshmukh, Senior Product Manager, Qase.
When we shipped the first version of the Qase MCP server in March, we made the obvious design choice: take the Qase API, expose one MCP tool per operation, ship it. That gave us 83 tools. It worked. Teams wired Claude, Cursor, and Codex into their test management data and started creating cases and reporting results without opening a browser tab.
It also had a cost that only shows up once people use it for real work.
Every tool you hand an AI assistant has to be described to that assistant first. Names, parameters, descriptions, all of it sits in the context window before the model has answered a single question. 83 tool definitions is a lot of reading before you get to the work. And when many of those tools look alike, create_case, update_case, get_case, get_cases, you've given the model 83 chances to reach for the wrong one instead of a handful.
So v2 is a rebuild of the tool surface. Same platform underneath, different shape at the edge where the AI touches it.
30 tools, organized by job
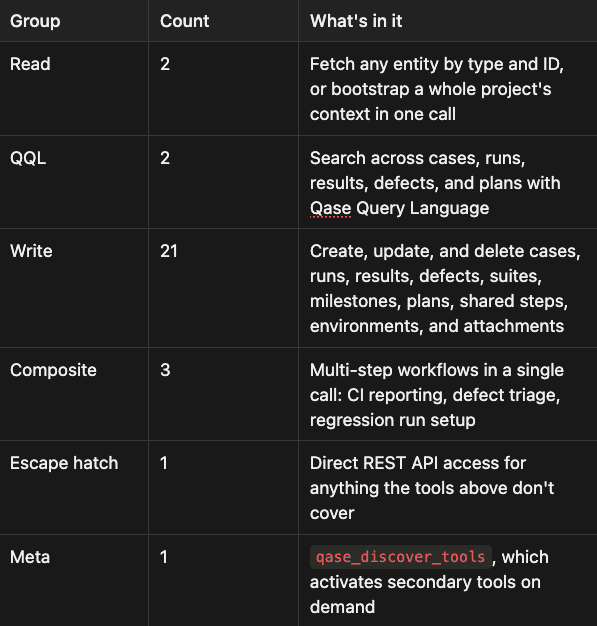
That's 29 task-oriented tools plus the discovery tool. The write group is where most of the collapsing happened: instead of a create tool and an update tool per entity, there's one upsert per entity. qase_case_upsert handles a new case and an edit to an existing one, and the model doesn't have to decide which verb it wants before it knows whether the case exists.
Two tiers, so the context stays small
Not every tool needs to be visible all the time. Deleting a milestone is a real thing people do, and it's also not the thing anyone does in their first session. Paying for its description in every session is waste.
v2 splits the 30 into 13 core tools that are always loaded and 17 discoverable tools that stay hidden until asked for. The hidden set is every delete operation, plus the upserts for suites, milestones, plans, shared steps, and environments, plus attachment upload and run completion. When you need one, the assistant calls qase_discover_tools with a term like delete or milestone, and the matching tools are activated for the rest of the session.
There's a trade-off in that, and it's worth naming. The first time you need a hidden tool, you pay one extra round trip to go find it. We think that's the right side of the deal, because the cost lands once per session on the operations you rarely run, and never on the ones you run constantly.
The tiering does a second job worth being explicit about. Every delete tool sits in the hidden set, so an assistant can't remove a case, a suite, or a run until something in the conversation has deliberately gone and activated it. That isn't a permission system, and it shouldn't be read as one. The server acts with exactly the access your API token has, so scope the token to what you're comfortable with an assistant doing.
One call to learn your project
The old pattern was ugly. Before an assistant could do anything useful, it worked out what your project actually contained: list the suites, then the milestones, then the environments, then the custom fields. Several calls spent on orientation before any work happened.
qase_project_context returns all of it in one response: project details, the suites tree, milestones, environments, custom fields, and users. It's cached for 5 minutes, so a burst of related requests reads the structure once.
Composite tools collapse the multi-step sequences
Three of the tools chain multiple API operations behind a single call:
qase_ci_reportcreates a run, records every result, and optionally completes the run.qase_regression_runcreates a run and adds all the cases matching a suite or plan selection.qase_triage_defectcreates a defect and links it to the failing tests.
"Report these CI results for project DEMO: case 1 passed, case 2 failed with a timeout error" used to be a conversation. Now it's one tool call, which means fewer places for the model to lose the thread halfway through.
QQL, so search isn't a fishing trip
qql_search takes a Qase Query Language expression and runs it across cases, runs, results, defects, and plans. "Find all failed test results from the last 7 days in project DEMO" resolves in one query, where v1 would have paginated its way through a list endpoint to get there. There's a companion qql_help tool, because an assistant guessing at query syntax is worse than an assistant that can look it up.
And an escape hatch
qase_api gives direct REST access to any endpoint. I'd rather you didn't need it. It's there because I know 29 tools don't cover every endpoint we ship, and a missing tool shouldn't be the thing that stops you.
What I'm not claiming
Fewer tools with clearer names should mean fewer tokens spent on setup and fewer wrong tool calls. That's the reasoning the design is built on, and it's why the counts moved the way they did.
We haven't published a benchmark, though, so take 83 to 30 as a count and nothing more. If you were running v1, the thing worth watching is whether your assistant needs fewer corrections to get the same job done. That's the number I care about, and I'd genuinely like to hear what you see.
Upgrading from v1
Tool names and response shapes both changed, so v1 prompts and scripts won't carry over untouched. MIGRATION.md has the full v1 to v2 mapping table and before-and-after examples for the response formats.
If you're starting fresh, install the server and give it an API token:
npm install -g @qase/mcp-server
export QASE_API_TOKEN=your_api_token_here
Then point your MCP client's stdio config at the @qase/mcp-server binary. It speaks stdio, SSE, and streamable HTTP, and it's been set up against Claude Desktop, Claude Code, Cursor, Codex, and OpenCode. The Quick Start has the per-client configs, and docs/tools.md is the tool-by-tool reference if you want to read the whole surface before you wire it up.
There's more coming on how you connect, including hosted options and per-client connectors. That gets its own post once it's ready.
And if you want the longer argument first, here's why we think test management belongs inside the SDLC tools engineers already have open.