News & Updates
Playwright Trace Viewer is now available in Qase
You can now view Playwright test traces right in Qase, without any extra tools. Open a failed test result, click Play Trace, and replay the whole execution path up to the breakpoint.

Andrei Vaganov
Now you can view Playwright test traces right in Qase without needing any extra tools.
As a developer, I sometimes struggle to keep my end-to-end (e2e) tests up to date.
Yes, I change the business logic. I can do this manually, or I can do it using AI agents.
As a result, some of my end-to-end tests might fail. Yet not because I did something wrong, but because I changed the business logic. This is a completely normal part of the development process.
And to be honest, sometimes I really do break something :) The main thing is that it doesn't make it to production.
At times like these, I want to see where EXACTLY the error occurred and what led up to it.
With Playwright, I usually handle this in one of three ways:
Option 1: Find the error location using the stack trace
Nothing new here. We look at the logs and search for errors. If necessary, we add debug logs.
Option 2: Use debug mode to walk through the steps yourself
You'll need to have Playwright installed locally and make sure it's up to date. You also need to know how to run it in debug mode in your development environment. Sometimes, you might even need a specific database state to reproduce the error.
Option 3: Download the trace.zip file and upload it to trace.playwright.dev
Playwright may generate a trace.zip file when running tests. If it generates one, you can upload it to trace.playwright.dev for analysis. However, you'll need to know what a trace.zip file is. You can find this information in the Playwright documentation, or ask your QA team or a developer.
In the worst case, no one will know what this file is or how it can help with debugging. It happens quite often actually.
Checking the stack trace is always useful, but I'm not a big fan of having to take additional manual steps in Option 1 and Option 2. Whenever possible, I'd like to avoid unnecessary steps when analyzing errors.
Option 4: Click Play Trace in Qase
Fortunately, you can now do this with just one click! The button sits on the test run result itself, next to the rest of the result's details.
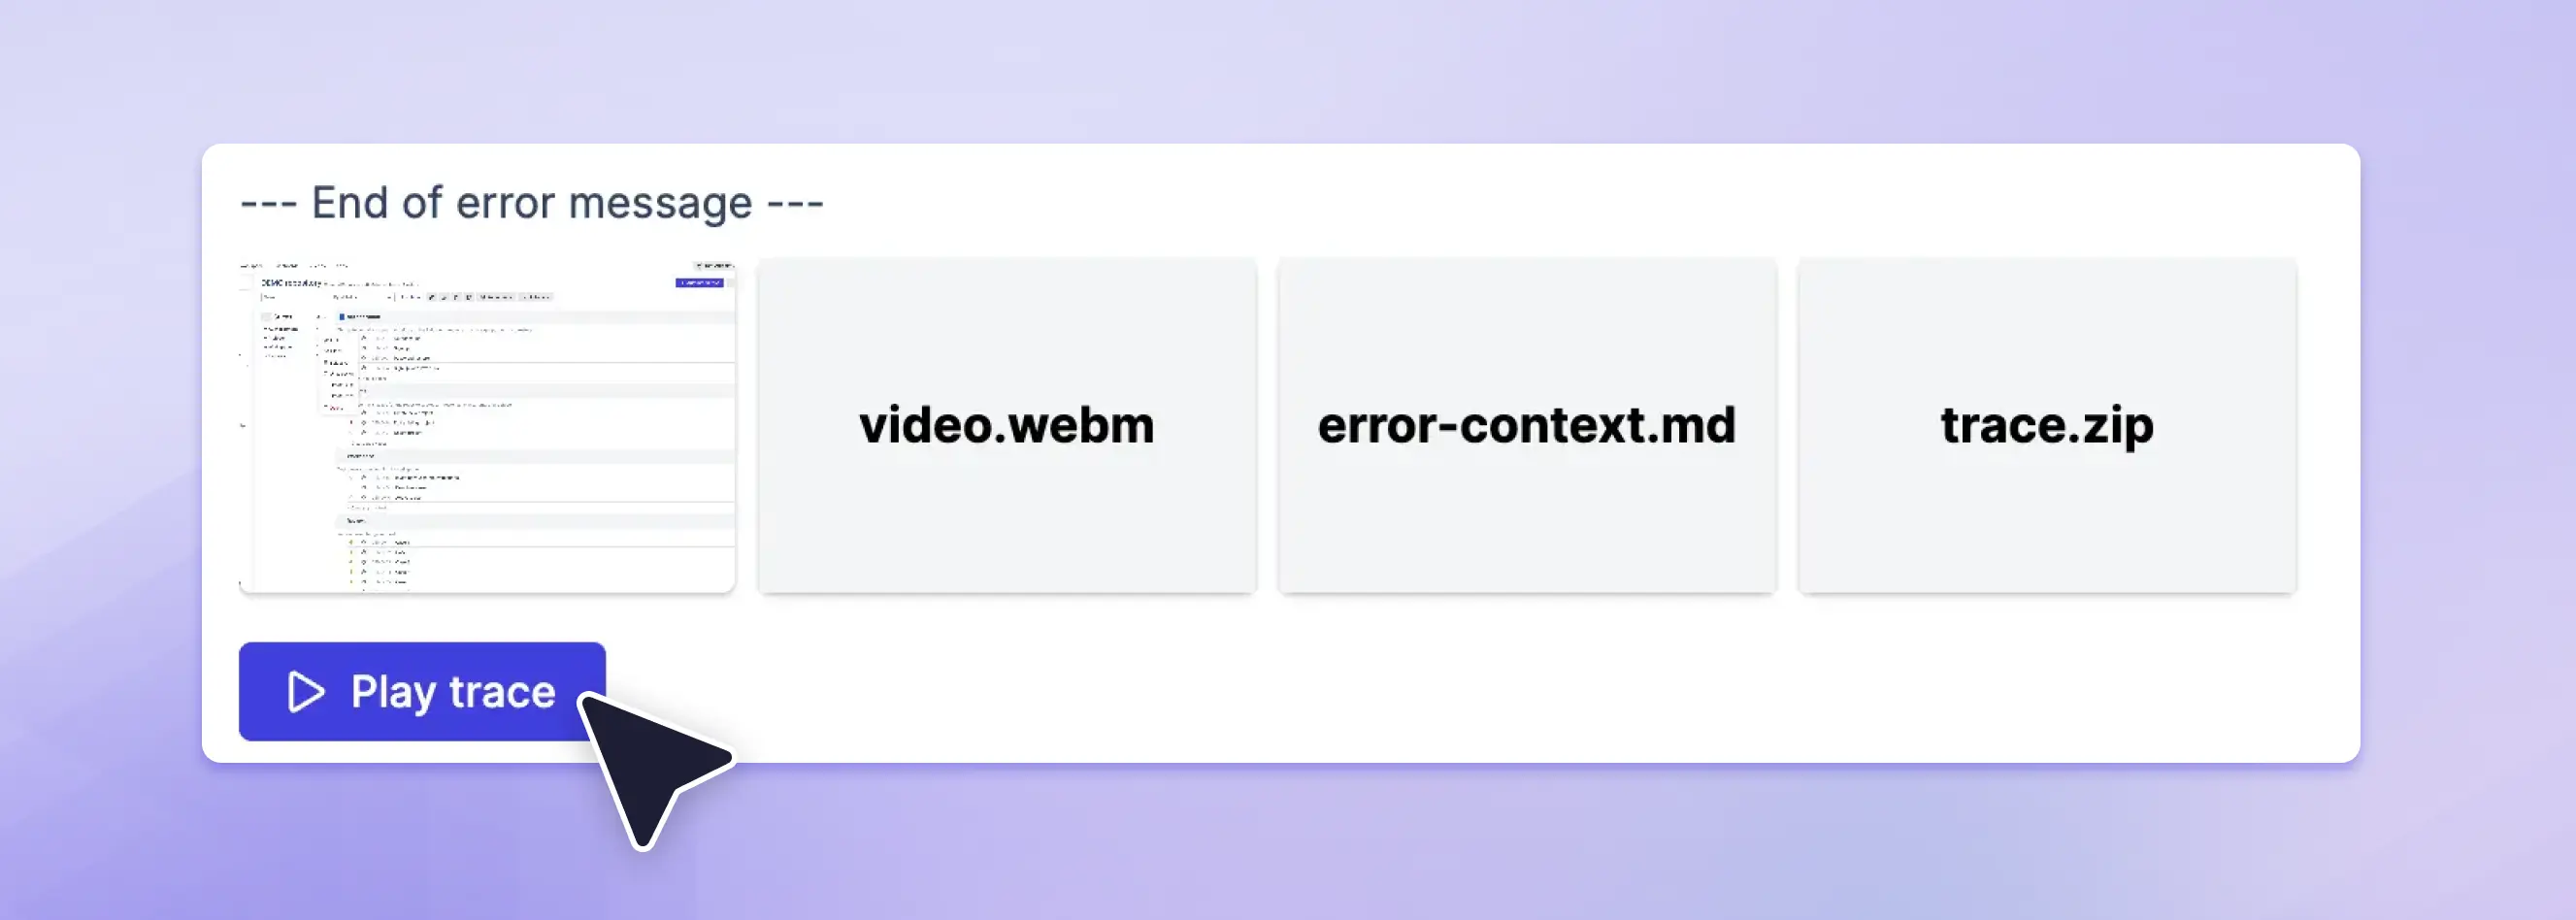
When you click the button, playwright-trace-viewer.app.qase.io opens in a separate tab, where you can see the entire test execution path right up to the breakpoint. This will help you quickly understand which part of the business logic caused the error.
For example, about a week ago, I was modifying the UI and improving the dark theme in Qase. In the process, I replaced the drop-down menu components. I thought none of the tests would fail, but that turned out not to be the case.
In the end, I simply opened the failed TestRunResult and clicked the Play Trace button.
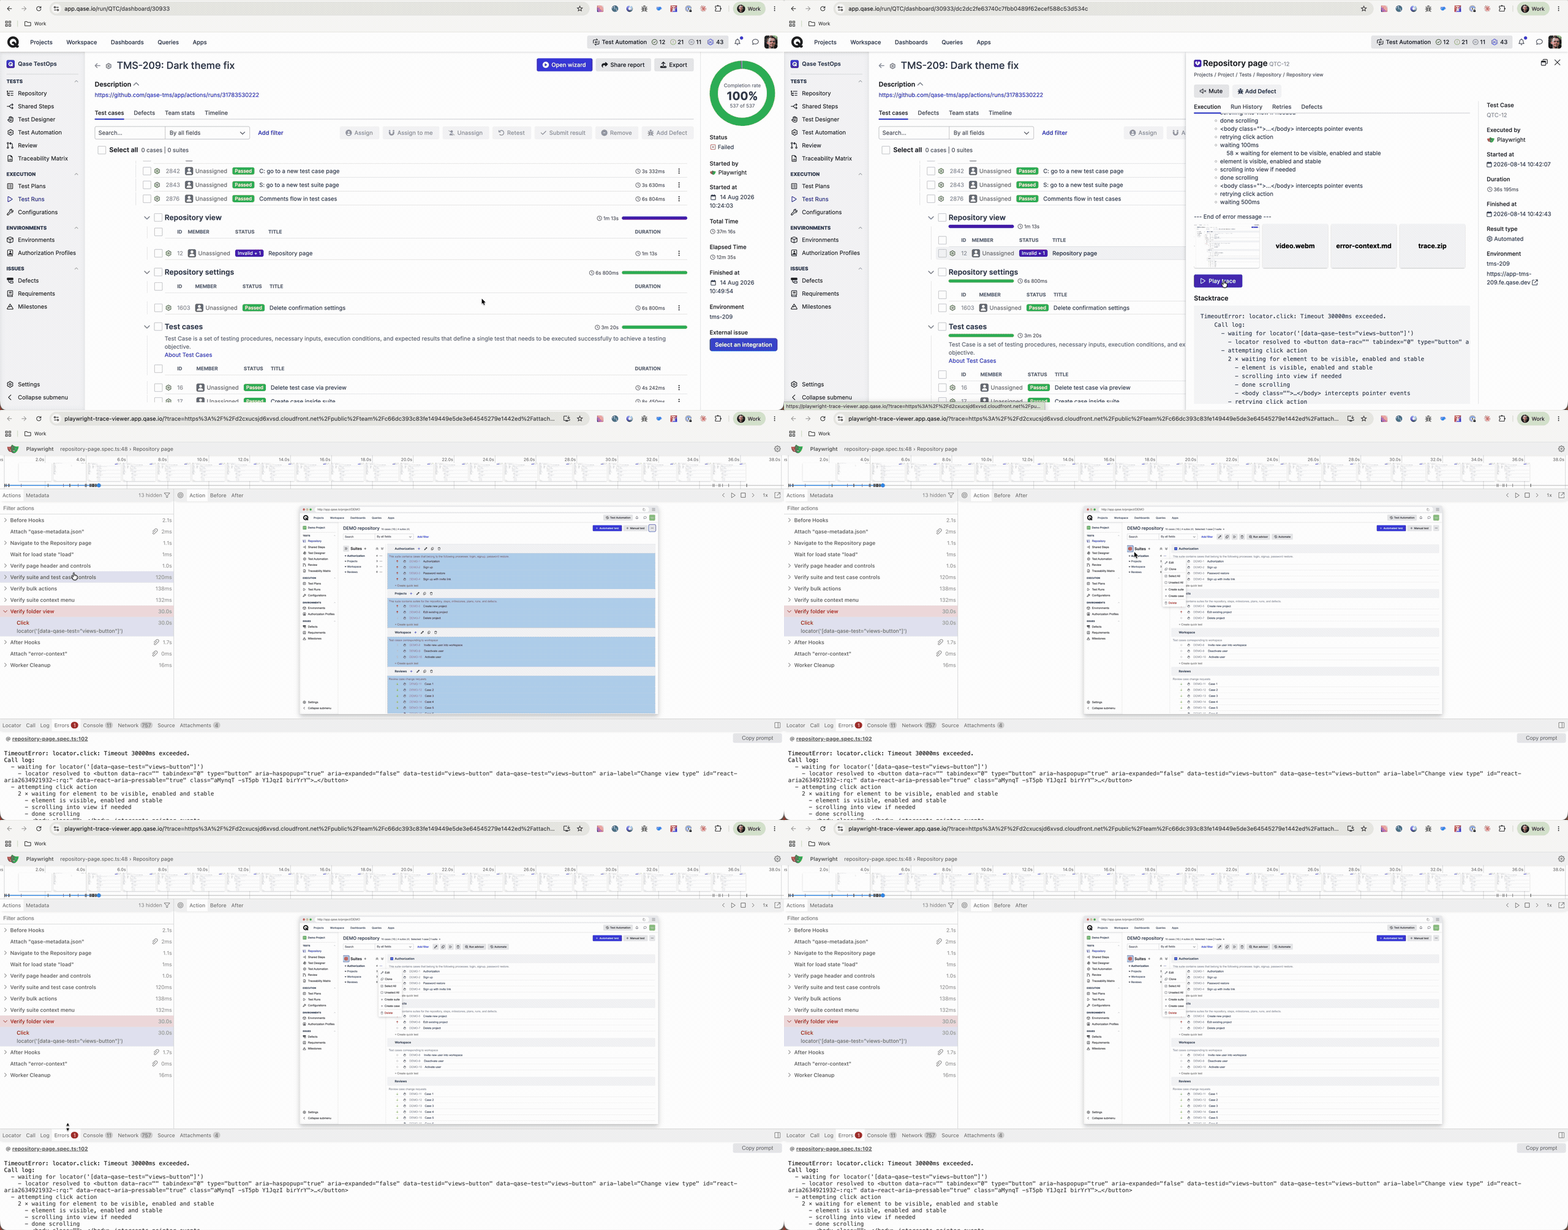
It turned out that the e2e test was written in a way that relied on a very specific behavior when closing the menu. It took me literally a few seconds to figure out what was going on.
I hope you find this as helpful as I did!