Automated Testing
Intercepting Sleep Calls in Tests with Qase

Dmitrii Gridnev
Introduction
As we've already covered in the article about Network Profiler, Qase provides powerful tools for monitoring and analyzing test scenarios. In this article, we'll explore another important profiler: Sleep Profiler, which helps identify and optimize the use of delays in tests.
The Problem with Using Sleep in E2E Tests
In E2E (end-to-end) tests, especially when working with UI controls and web applications, developers often use time.sleep() to wait for elements to appear on the page, for animations to complete, or for data to load. This is a simple solution, but it has serious drawbacks:
- Increased test execution time: Fixed delays always wait for the full duration, even if the element appears earlier
- Test instability: If an element loads slower than expected, the test may fail
- Hidden performance issues: It's difficult to understand exactly where tests are spending time waiting
- Debugging complexity: It's impossible to see all places where delays are used without manually searching through the code
The Right Approach: Conditional Waits
Instead of fixed delays, it's recommended to use smart waits with condition checking. For example, in Playwright this is page.wait_for_selector() ; in Selenium, WebDriverWait with expected_conditions. These mechanisms check the condition periodically and complete as soon as the condition is met, which significantly speeds up tests.
What is Sleep Profiler
Sleep Profiler is a Qase tool that automatically intercepts all time.sleep() calls in your tests and logs them as separate steps. This allows you to:
- Find all places with delays: See all
sleep()calls in one place - Measure wait time: Understand how much time is spent on delays
- Optimize tests: Identify places where
sleep()can be replaced with smart waits - Analyze performance: Assess the impact of delays on overall test execution time
How Sleep Profiler Works
Sleep Profiler uses Monkey Patching technique to intercept time.sleep() calls. It replaces the standard time.sleep function with its own wrapper that:
- Logs the start of the delay with the specified duration
- Executes the original
time.sleep() - Logs the completion of the delay
- Sends delay information to Qase as a separate step
Usage Examples
Basic Example with pytest and Playwright
Let's consider a simple E2E test using Playwright that demonstrates the problem and solution:
❌ Bad Example: Using sleep
Execution time: ~11 seconds (minimum, even if everything loads faster)
We can see in the result that delays added in each step increase the total test execution time:
✅ Good Example: Using Smart Waits
Execution time: ~4 seconds (completes as soon as conditions are met)
We can see that using smart waits significantly reduced the test execution time:
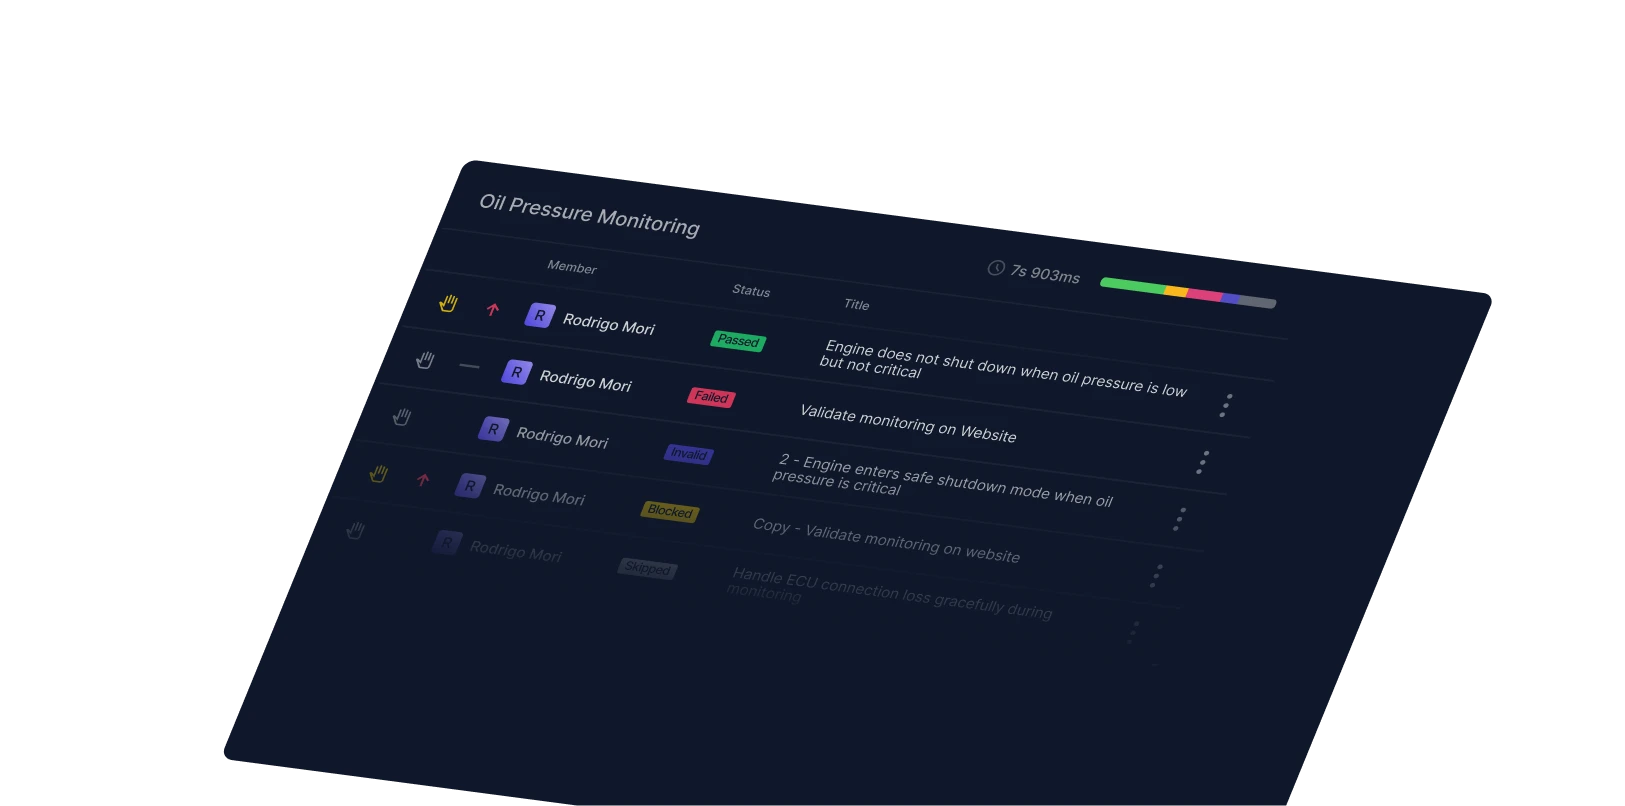
Getting Reports with Sleep Profiler
After running tests with Sleep Profiler enabled, you'll receive a detailed report in Qase where each time.sleep() call is displayed as a separate step with the duration specified. This makes it easy to analyze and optimize the use of delays in your tests.
Configuration
To enable Sleep Profiler in your tests, you can use two approaches: via command line or via the qase.config.json configuration file.
Enabling via Command Line
Configuration via qase.config.json File
Optimization Recommendations
After Sleep Profiler has helped you find all places with sleep(), it's recommended to:
- Replace with smart waits: Use
wait_for_selector(),wait_for_url(), and similar methods - Use timeouts: Set reasonable timeouts for waits (usually 5-10 seconds)
- Check conditions: Instead of waiting for time, wait for conditions to be met
- Monitor performance: Regularly check Sleep Profiler reports to identify new issues
Conclusion
Sleep Profiler is a powerful tool for optimizing E2E tests. It helps identify all places where fixed delays are used and assess their impact on test execution time. By using Sleep Profiler in combination with smart waits, you can significantly speed up your tests and make them more stable.
Related Posts
You might also like

Automated Testing
Qase Report: Interactive Test Reports in a Single Command
Dmitrii Gridnev

Automated Testing
Capturing Database Queries in Tests with Qase
Dmitrii Gridnev

Automated Testing
Intercepting HTTP Requests in Tests with Qase
Dmitrii Gridnev