Automated Testing
Capturing Database Queries in Tests with Qase

Dmitrii Gridnev
Introduction
As covered in the articles on Network Profiler and Sleep Profiler, Qase provides powerful tools for monitoring and analyzing test scenarios. This article explains Database Profiler—a tool that automatically tracks and logs database operations.
The Problem with Databases in Tests
In integration and E2E tests, the database is critical. Without profiling it’s hard to see:
- Which queries ran and how long they took
- Why tests are slow: which specific query is the bottleneck
- Where to debug: the exact query text and error message
- How much data changed: number of affected rows
What is Database Profiler
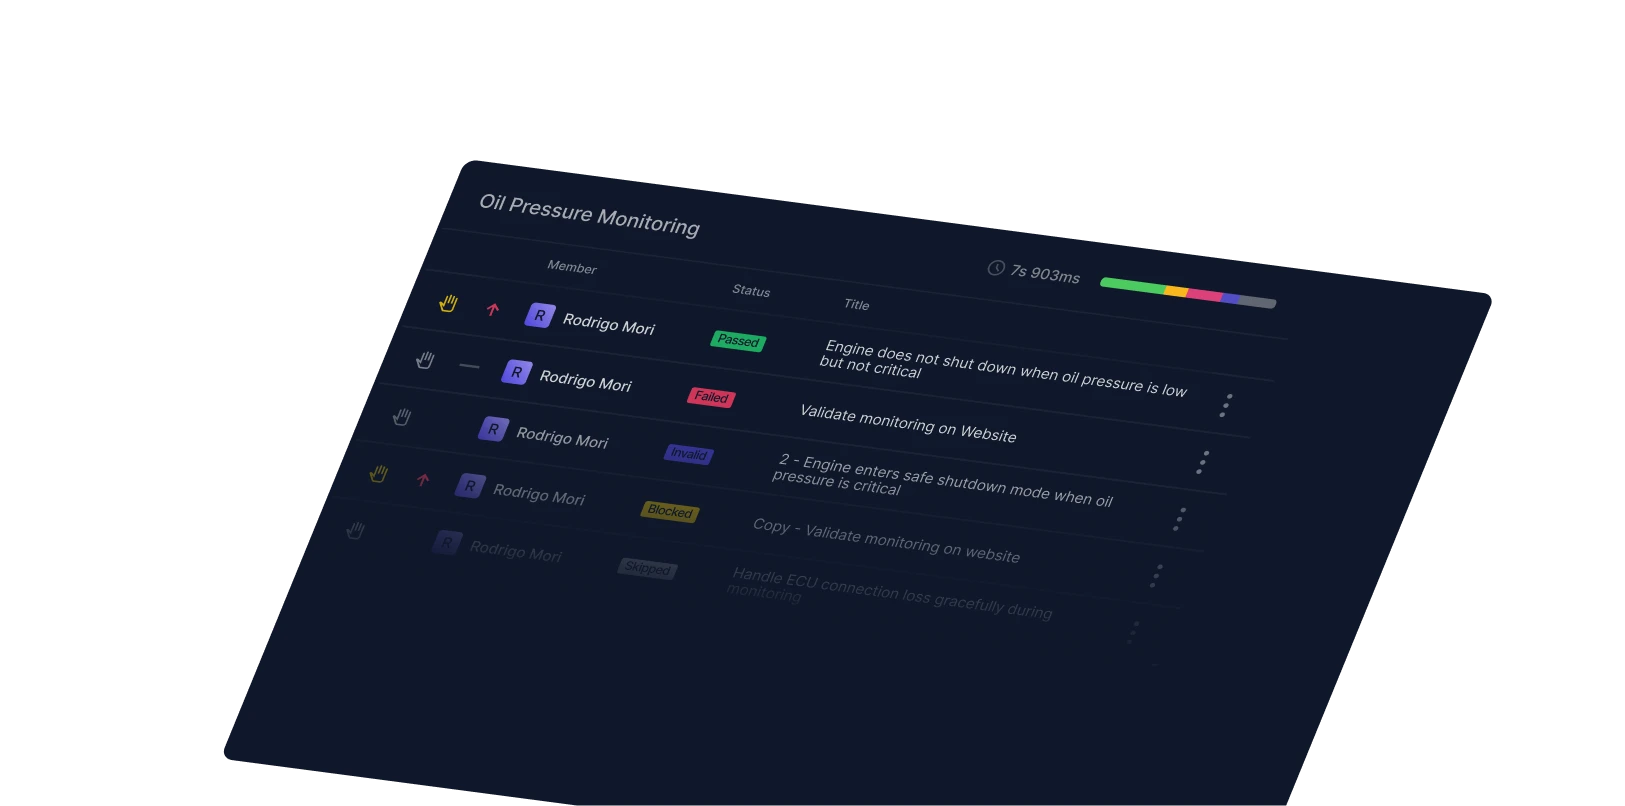
Database Profiler intercepts SQL queries and sends each call to Qase as a separate step. You see the query text, execution time, affected rows, and connection info.
How Database Profiler Works
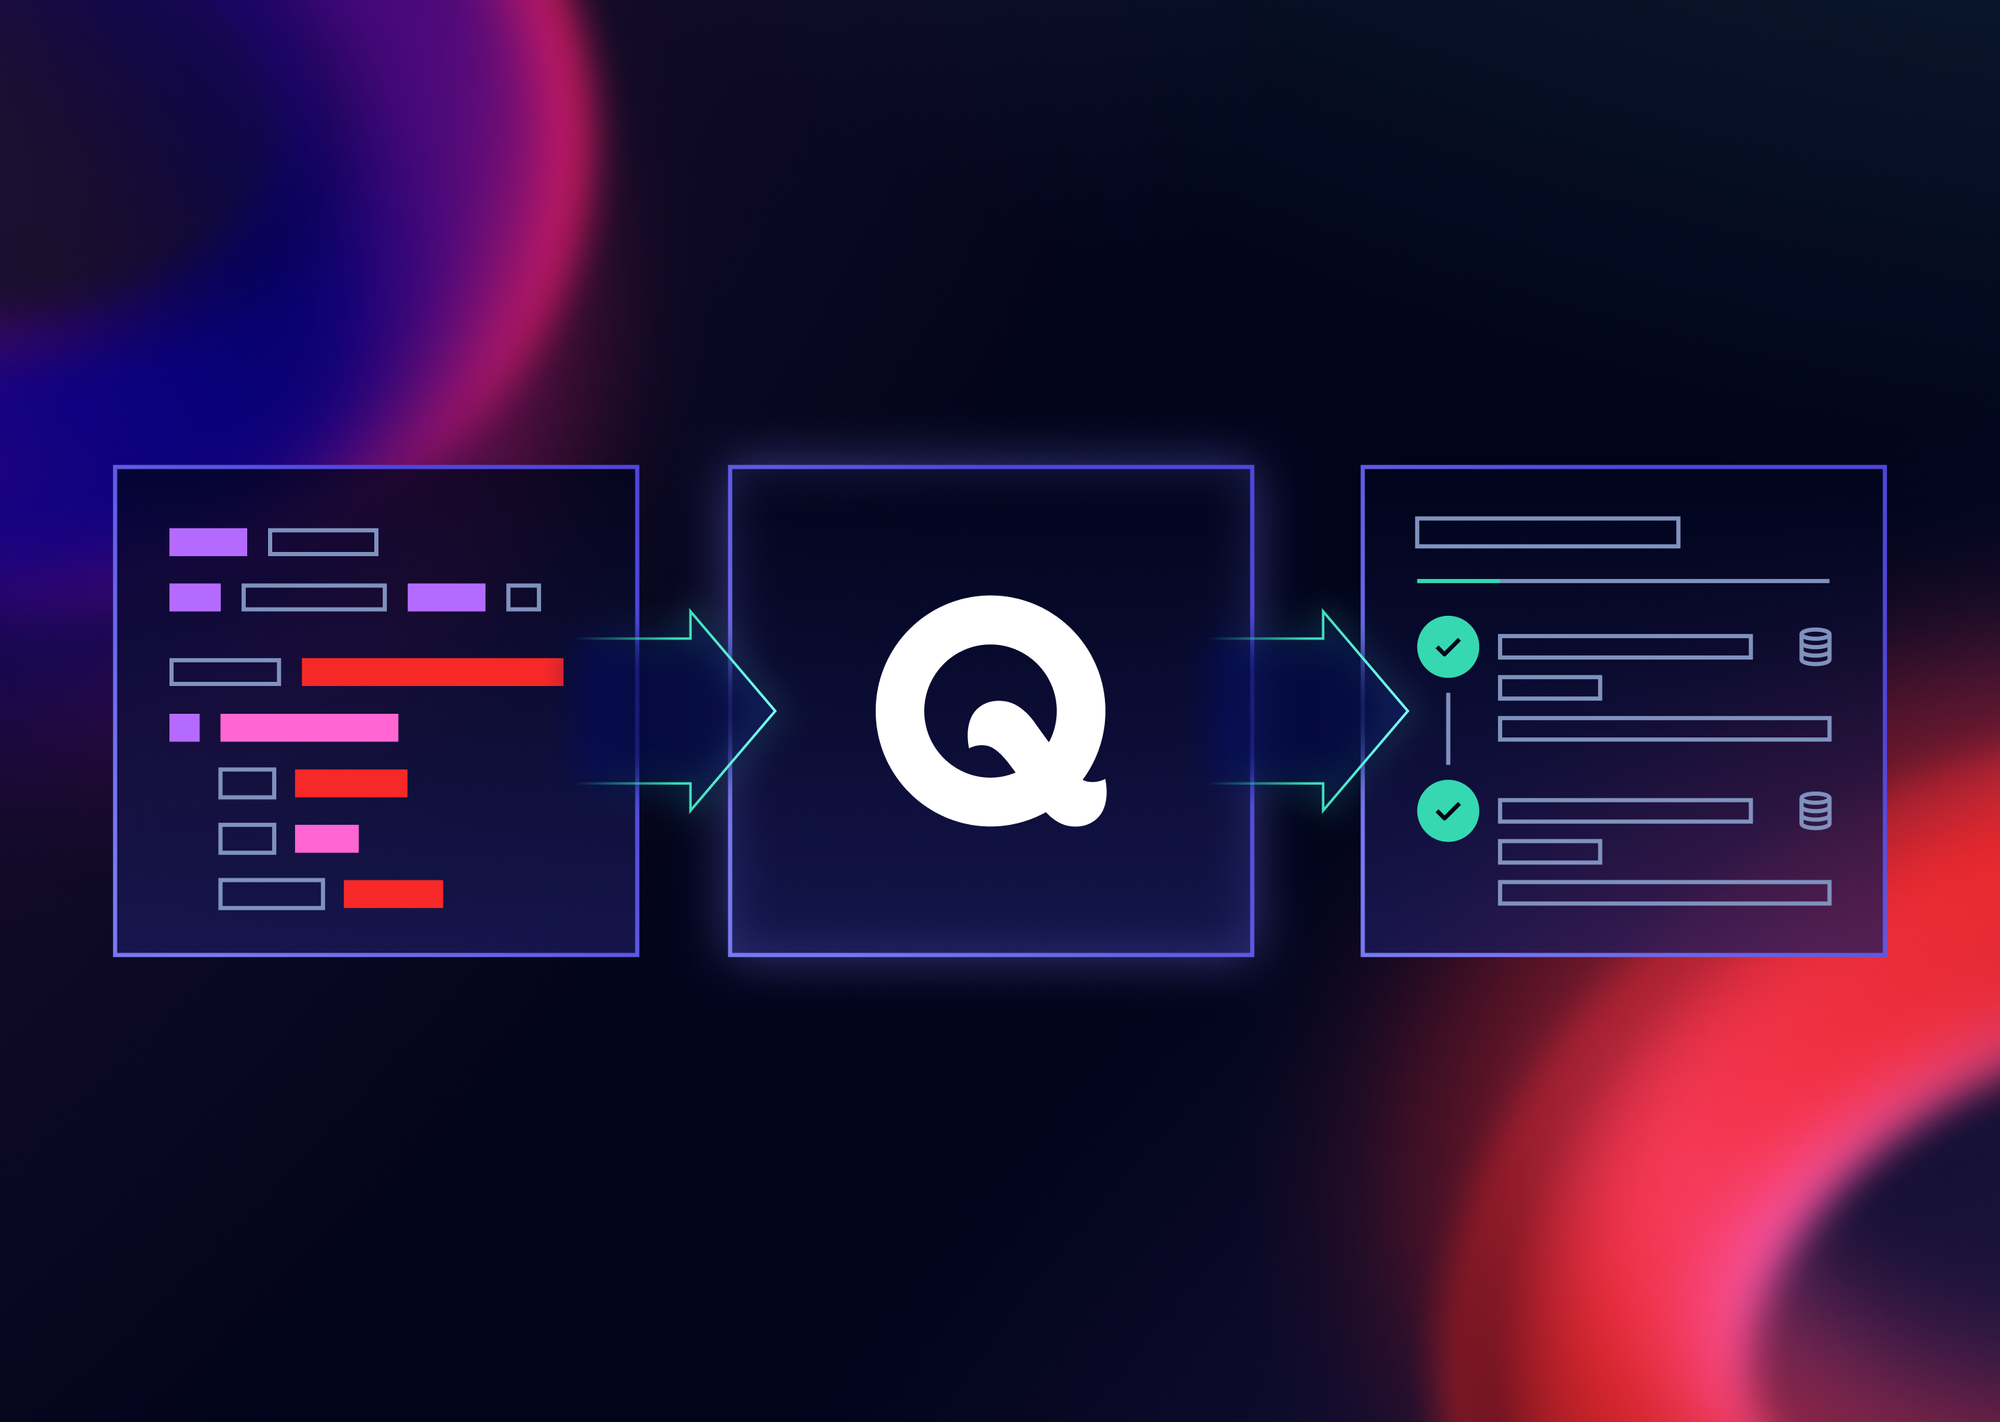
It relies on monkey patching and proxy classes: the profiler wraps query execution methods, measures their time, and sends the data to Qase TestOps as test steps.
Usage Example (PostgreSQL + pytest)
Configuration
Via command line
Via qase.config.json
Conclusion
Database Profiler gives full visibility into SQL queries in tests: query text, timing, affected rows, and connection context. It accelerates bottleneck analysis, simplifies debugging, and helps keep tests stable and fast.
Related Posts
You might also like
Automated Testing
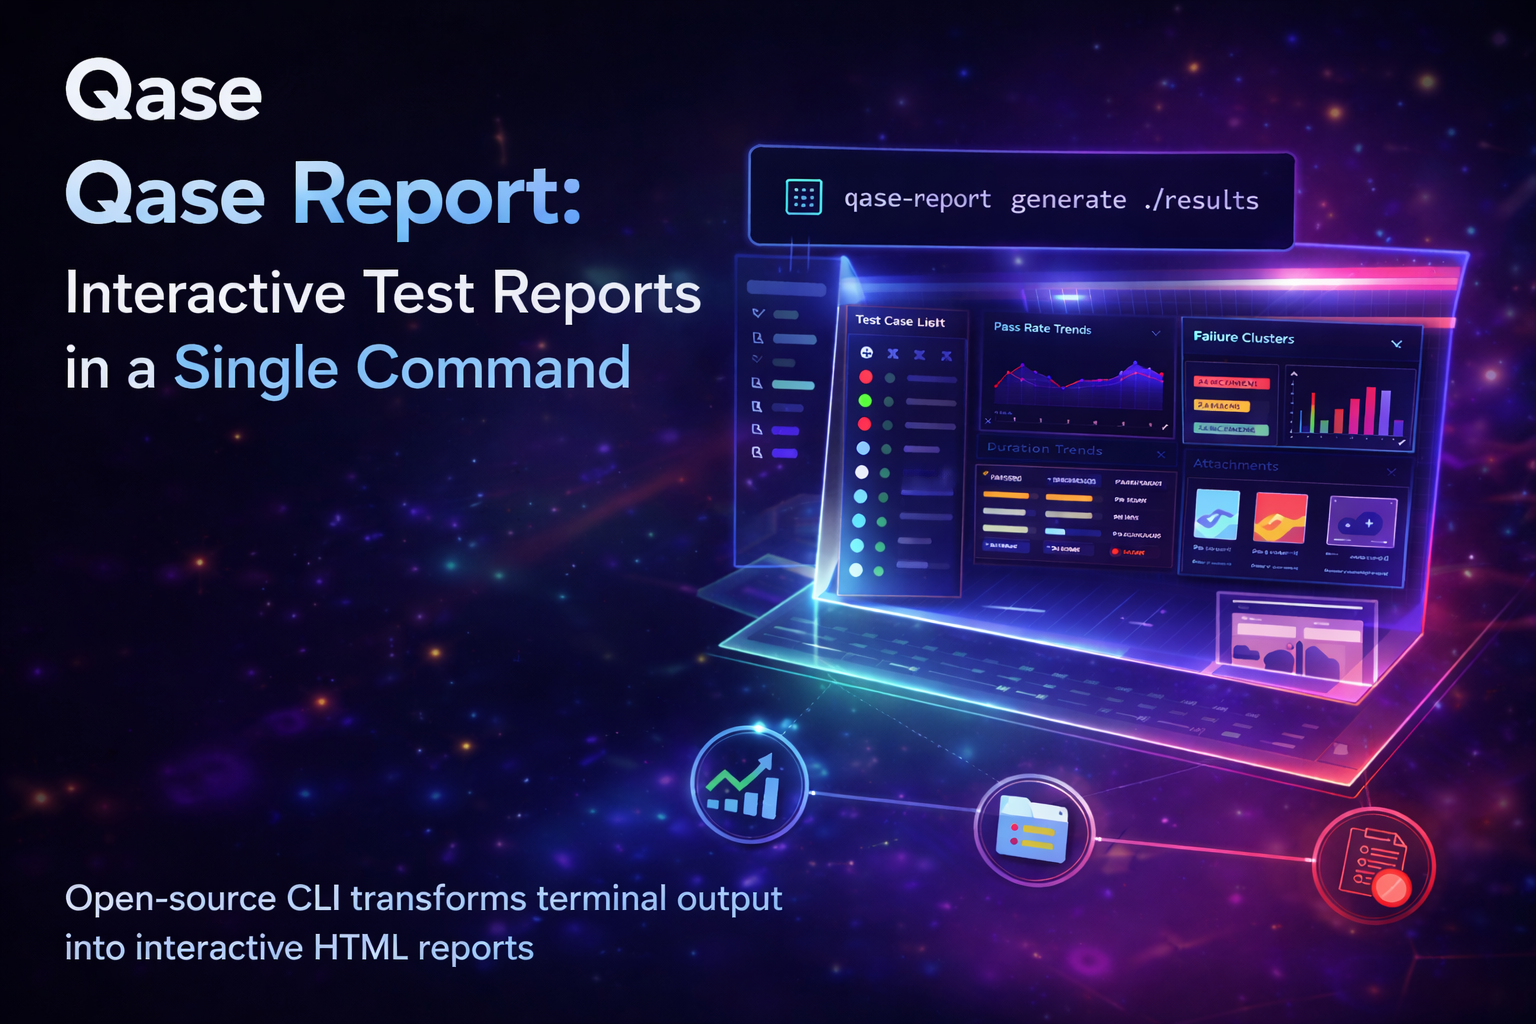
Qase Report: Interactive Test Reports in a Single Command
Dmitrii Gridnev
Automated Testing
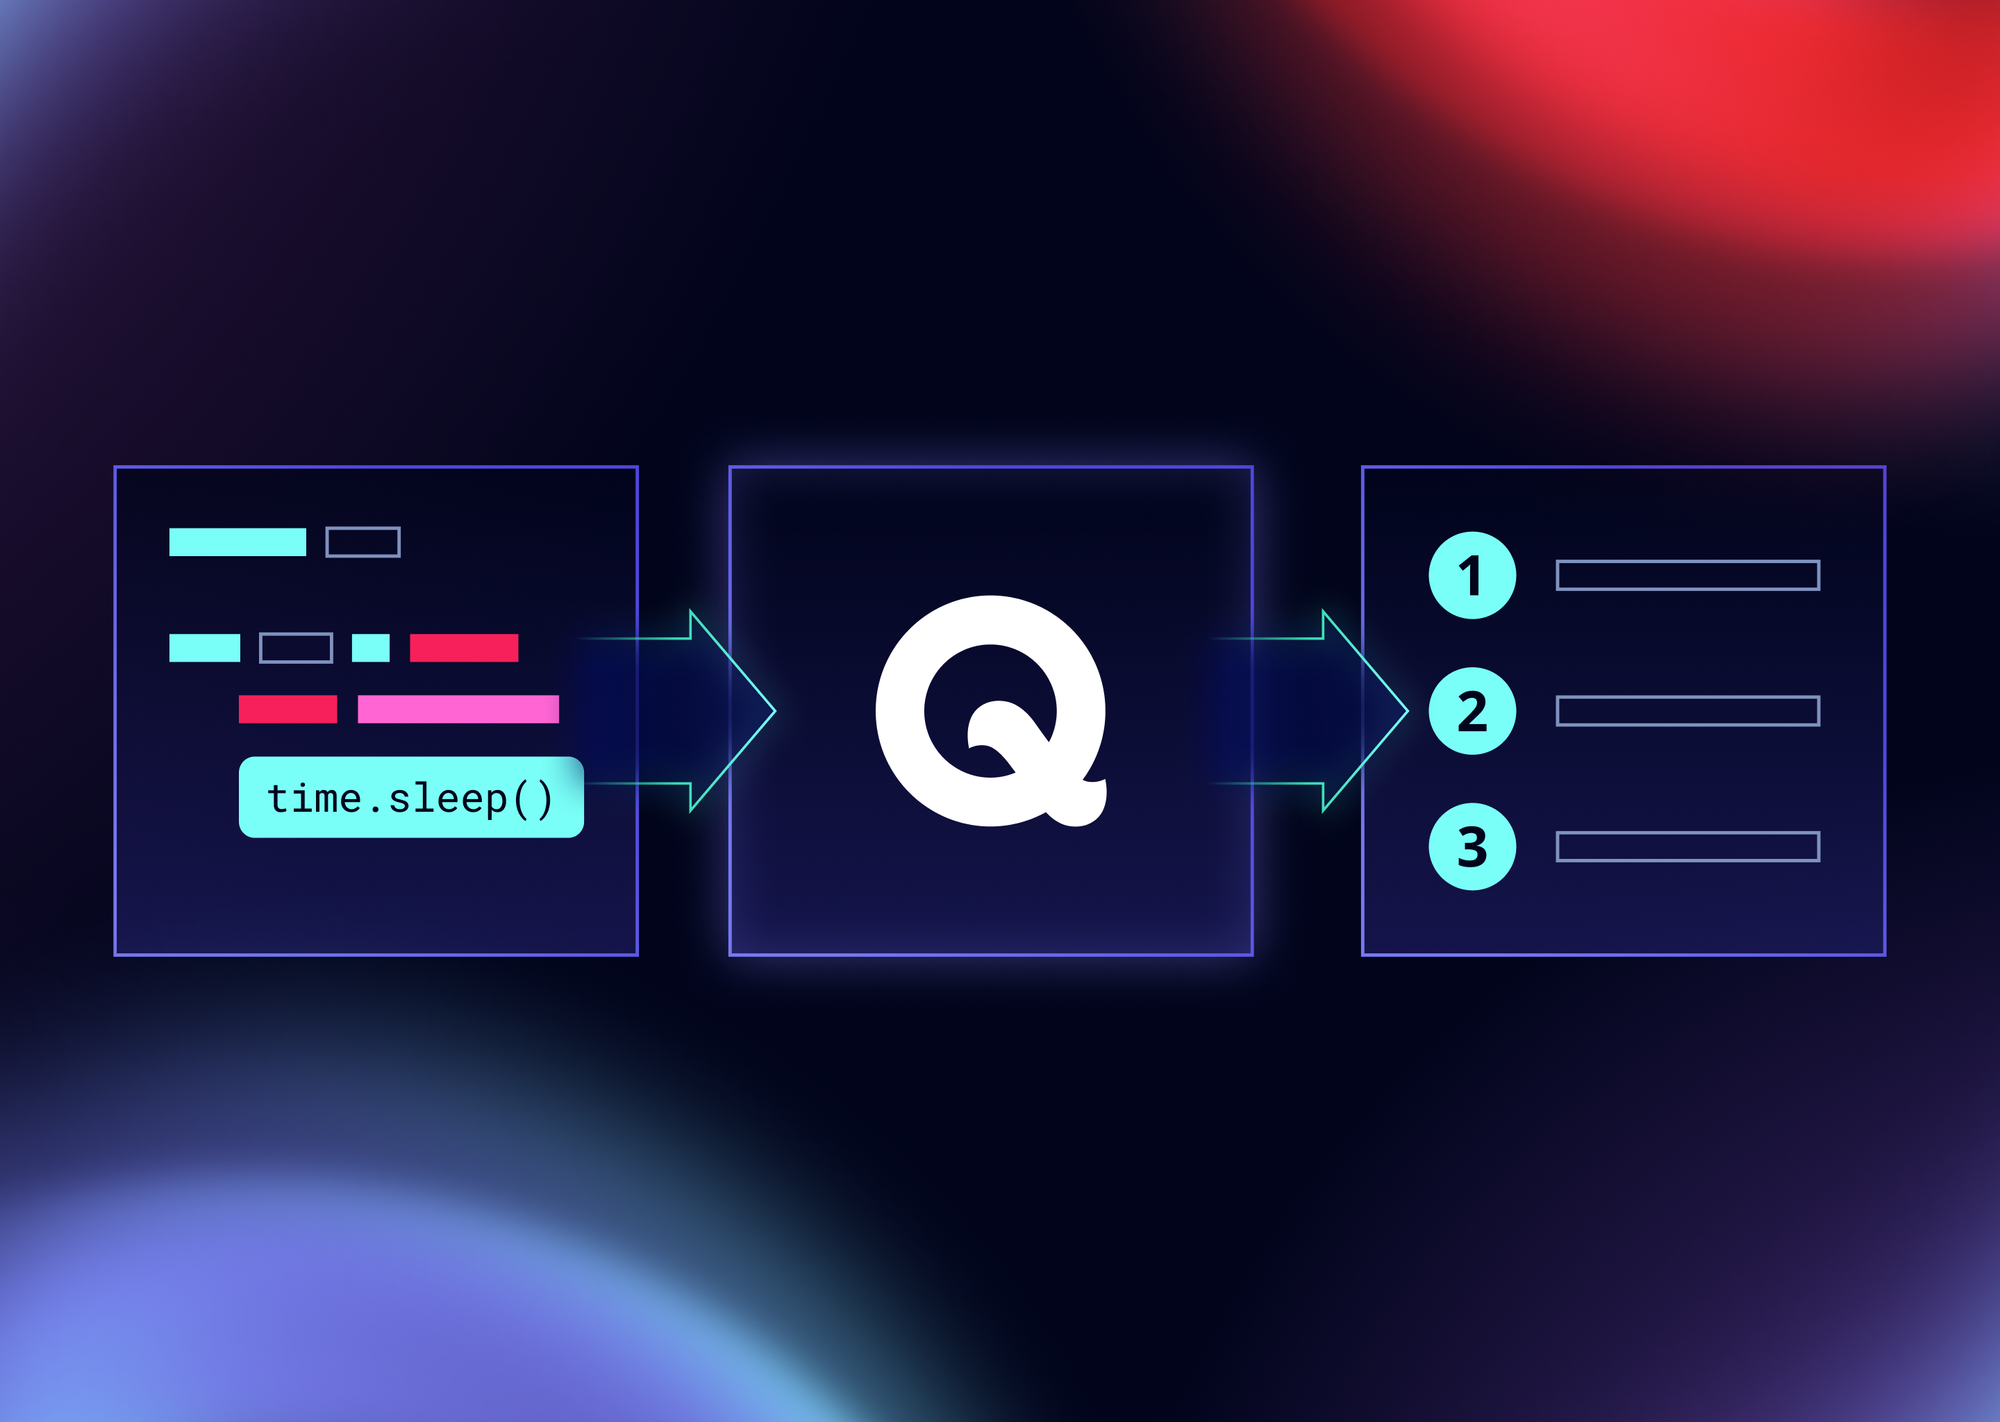
Intercepting Sleep Calls in Tests with Qase
Dmitrii Gridnev
Automated Testing
Intercepting HTTP Requests in Tests with Qase
Dmitrii Gridnev